
Topic
performance
2026-09-30 · notes
1,485 Error Checks and Zero Import Cycles: Dissecting Prometheus's 84-Package Engine with 67 AST ToolsWe benchmarked all 67 prod-code AST tools against prometheus/prometheus: 385K lines of Go, 84 packages, 1,485 error checks, 99% slicing reduction, and Bug #740 fixed in remote module dependencies.
9 min
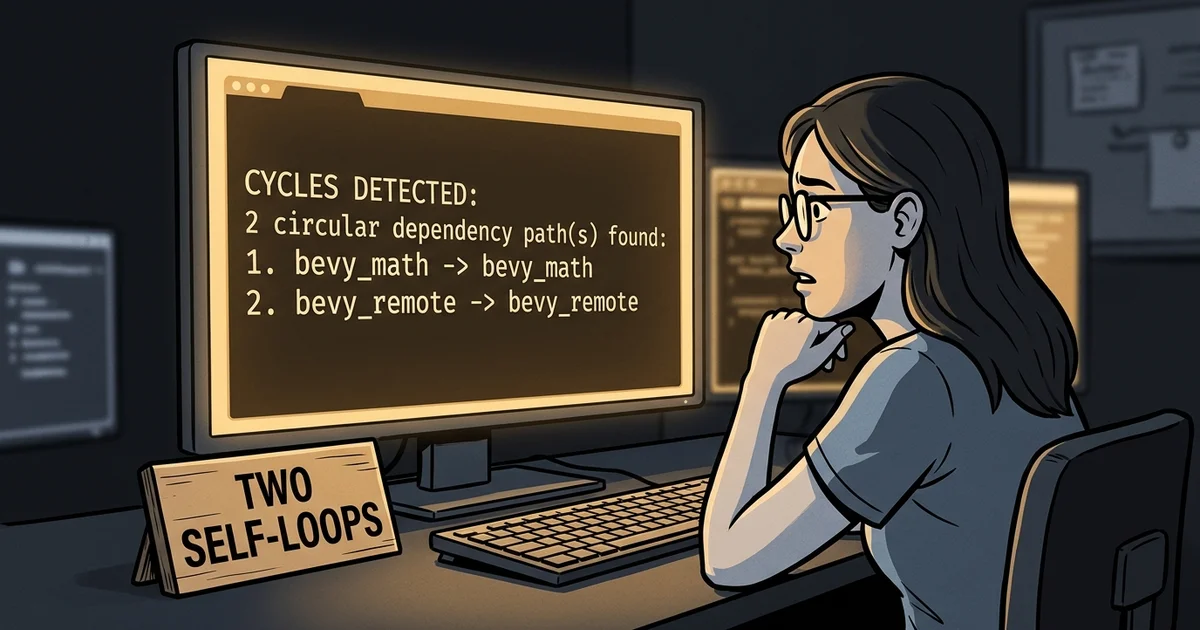
2026-09-30 · notes
204 Code Clones and Two Self-Loops: Dissecting Bevy's 97-Crate Engine with 67 AST ToolsWe benchmarked all 67 prod-code AST tools against bevyengine/bevy: 661K lines of Rust, 97 crates, 204 exact code clones, 2 dev-dependency loops, and Bug #739 discovered and fixed in fast-sync.
9 min
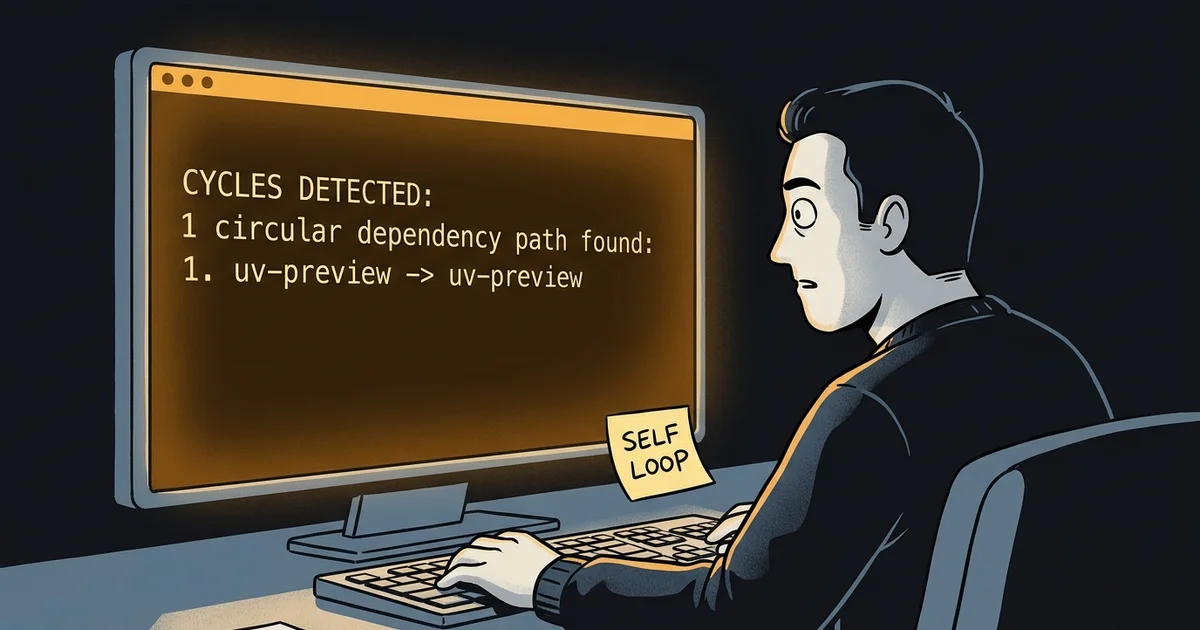
2026-09-30 · notes
347 Code Clones and a Self-Loop: Breaking Down uv's 74-Crate Workspace with 67 AST ToolsWe benchmarked all 67 prod-code AST tools against astral-sh/uv: 559K lines of Rust, 74 crates, 347 duplicated test clones, a self-referential cycle in uv-preview, and Issue #738 resolved in fast-sync.
10 min
2026-09-30 · notes
5.3 Million Lines of Go and 779 Packages: Dissecting Kubernetes with 67 AST ToolsWe benchmarked all 67 prod-code AST tools against kubernetes/kubernetes: 5.38M lines of Go across 17,823 files, 779 packages, 0% laptop CPU, and fixed Bugs #741 and #742 in Go signature compilation and predicate inversion.
9 min
2026-09-30 · notes
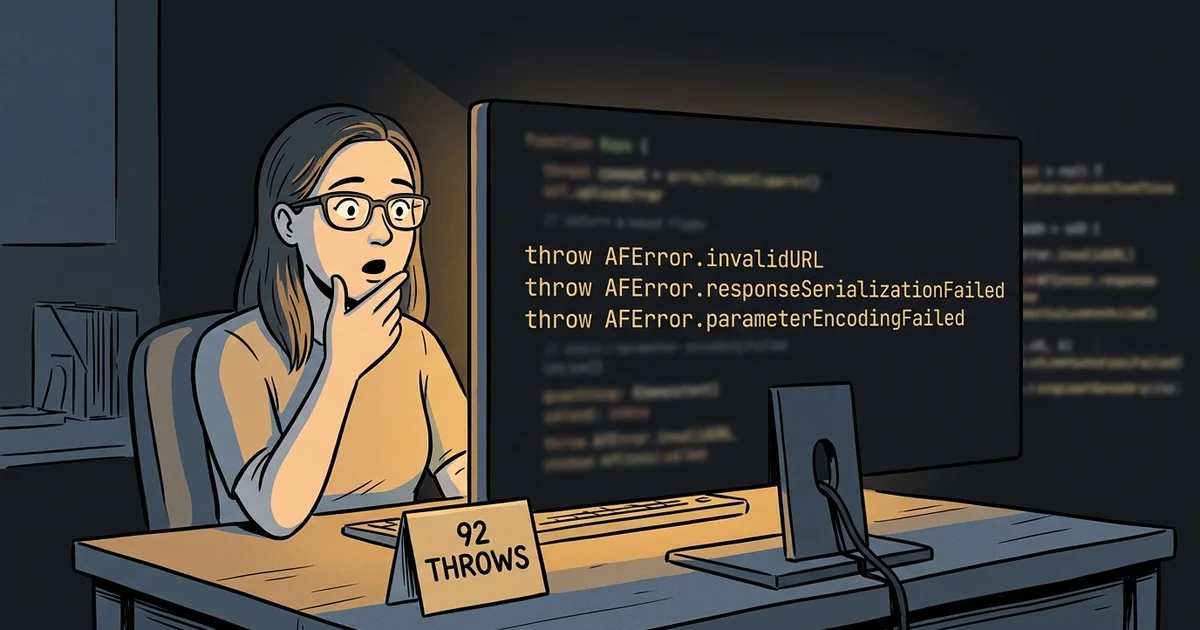
Alamofire Under the Microscope: What 67 AST Tools Found Inside the Swift Networking EngineWe benchmarked all 67 prod-code AST tools against Alamofire: 39,000 lines of Swift, 92 error egress boundaries, 20 clone groups, and remote Apple Silicon test offloading.
3 min
2026-09-30 · notes
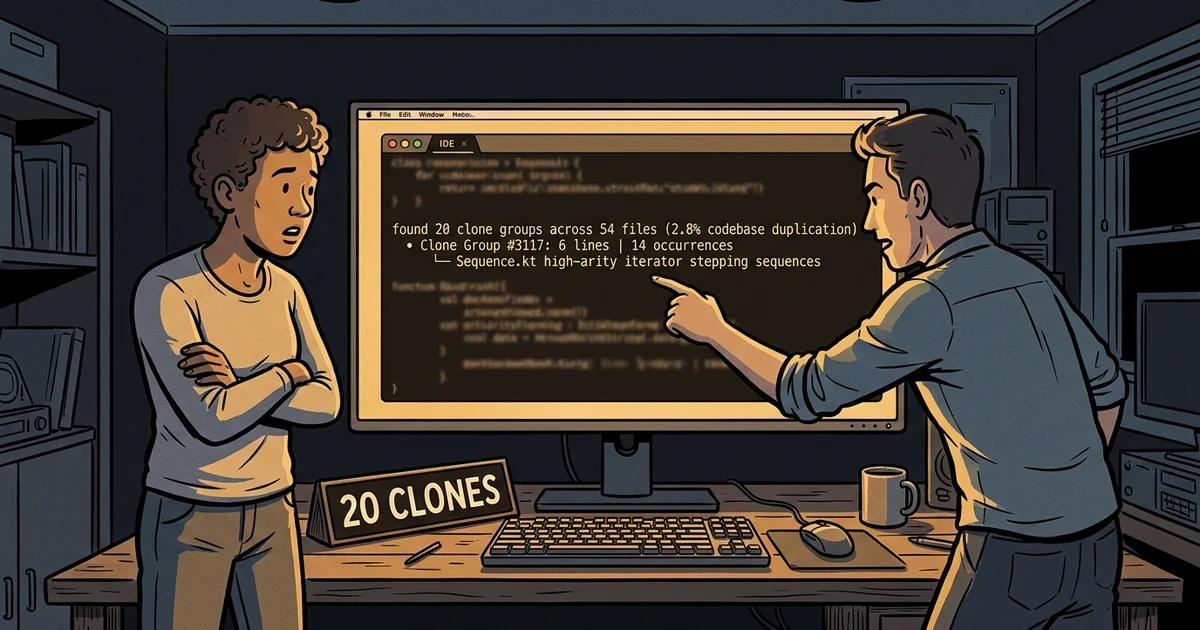
Arrow Under the Microscope: What 67 Remote AST Tools Found Inside Kotlin's Functional CoreWe evaluated prod-code AST tools against arrow-kt/arrow: 72,889 lines of Kotlin across 757 files, 38-module Gradle architecture, structural search for the Raise DSL, and cluster-verified AST refactoring.
3 min
2026-09-30 · notes
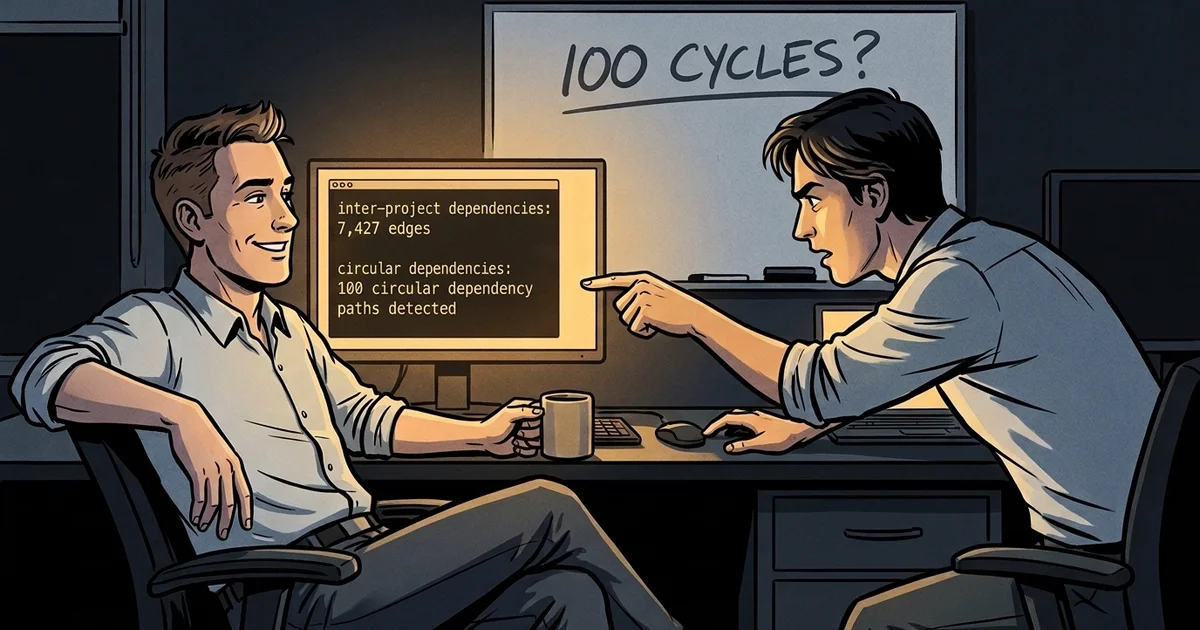
ASP.NET Core Under the Microscope: What 67 Remote AST Tools Found Inside Microsoft's Web EngineWe evaluated prod-code AST tools against dotnet/aspnetcore: 1,757,169 lines of C# across 10,685 files, 625 projects in a single repository, Roslyn generator snapshot clones, and cluster-verified OmniSharp refactoring.
3 min
2026-09-30 · notes
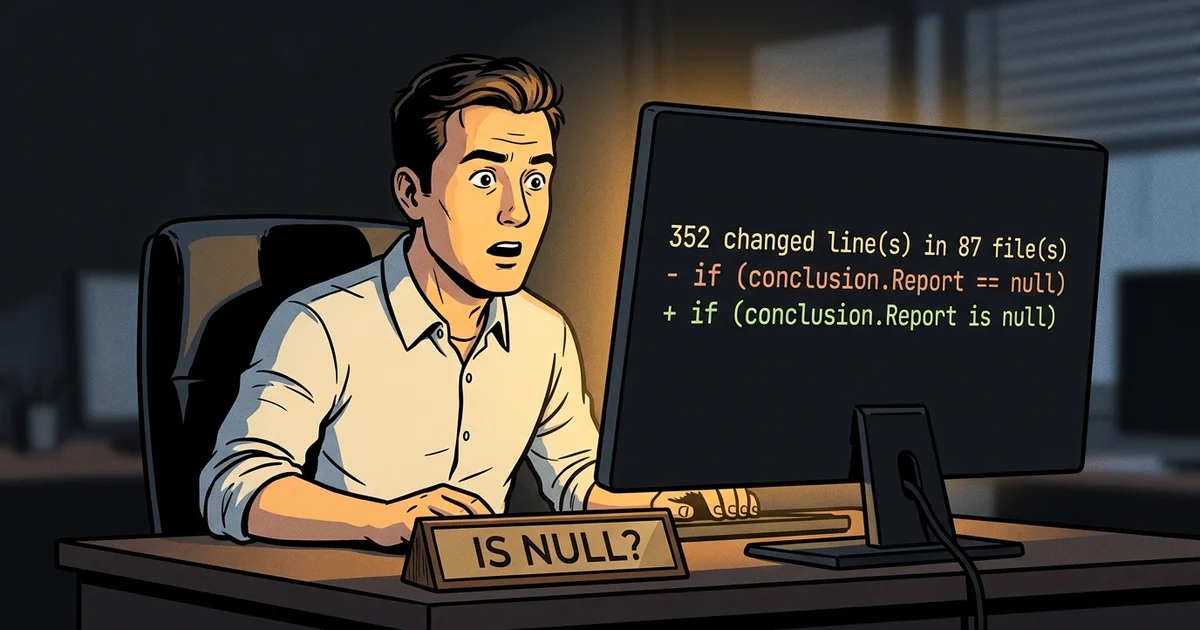
BenchmarkDotNet Under the Microscope: What 67 Remote AST Tools Found Inside the .NET Micro-Benchmarking EngineWe evaluated prod-code AST tools against dotnet/BenchmarkDotNet: 120,810 lines of C# across 1,175 files, 29 projects in an acyclic DAG, 1,120 benchmark harnesses, and cluster-verified OmniSharp refactoring.
4 min
2026-09-30 · notes
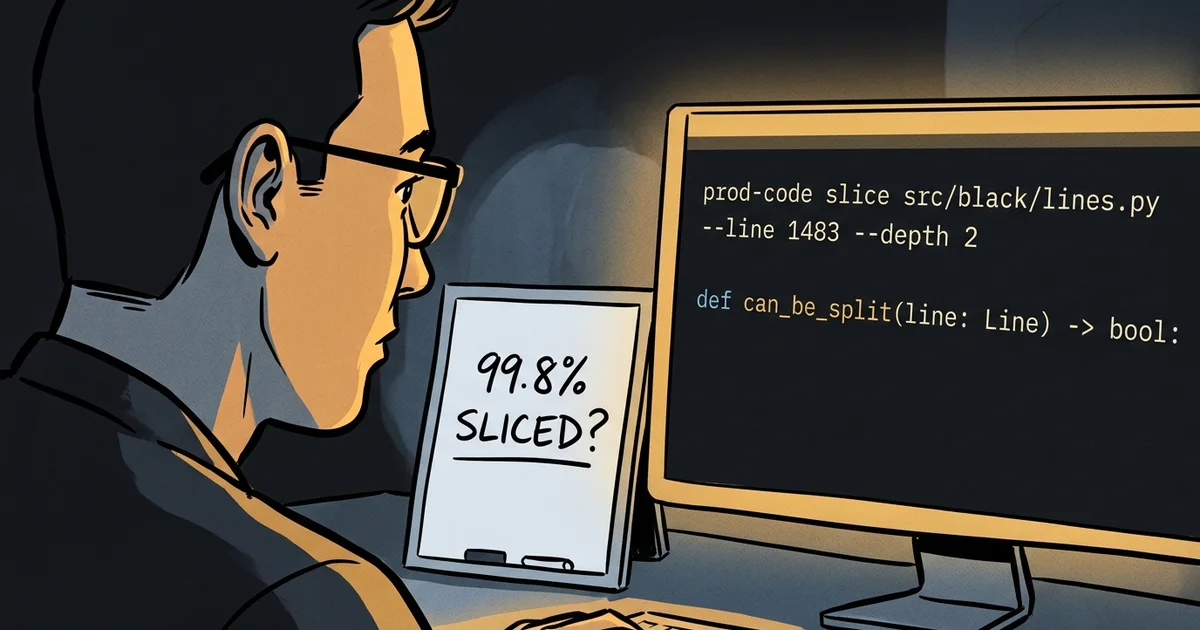
Black Under the Microscope: What 67 AST Tools Found Inside Python's Uncompromising FormatterWe benchmarked all 67 prod-code AST tools against psf/black: 135K lines of Python, 12-callsite parameter object bundling across 4 files, import cycle detection in concurrency, 99.8% slicing reduction, and mathematical safety proofs in predicate inversion.
5 min

2026-09-30 · notes
curl Under the Microscope: What 67 AST Tools Found Inside the Ubiquitous Transfer EngineWe benchmarked all 67 prod-code AST tools against curl/curl: 200,000 lines of C, 1,924 failure and diagnostic egress points, and parameterized AST codemods.
2 min
2026-09-30 · notes
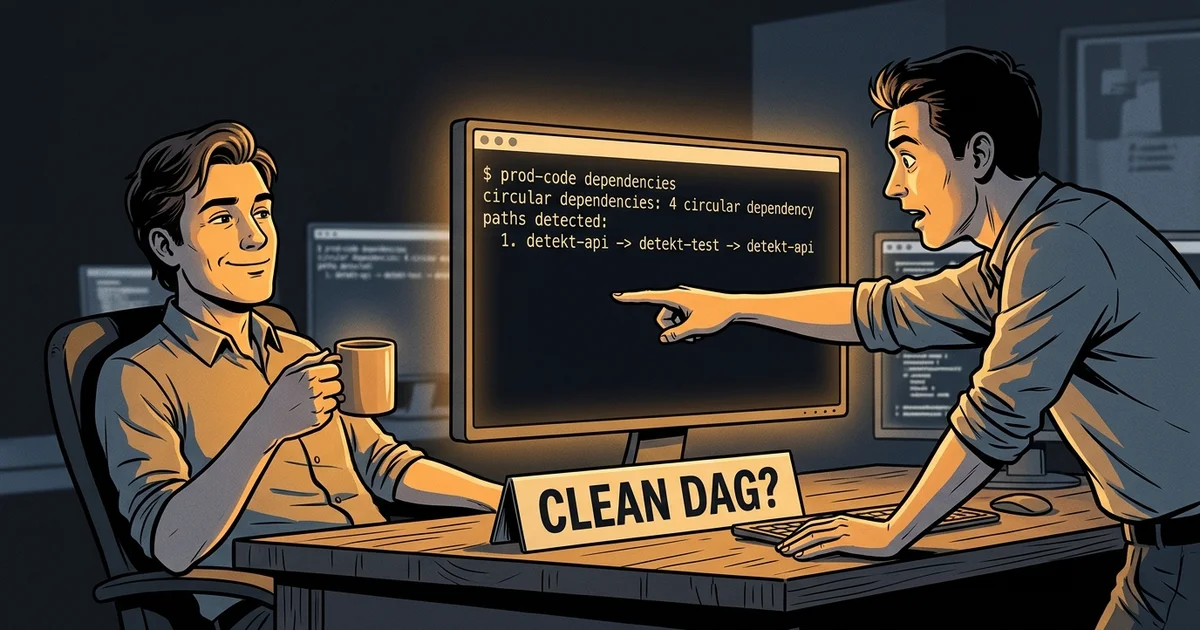
Detekt Under the Microscope: What 67 Remote AST Tools Found Inside Kotlin's Static Code AnalyzerWe evaluated prod-code AST tools against detekt/detekt: 132,028 lines of Kotlin across 1,105 files, 41-module Gradle architecture with 4 test cycles, structural search across 31 files, and cluster-verified AST refactoring.
3 min
2026-09-30 · notes
DuckDB Under the Microscope: What 67 AST Tools Found Inside the Analytical EngineWe benchmarked all 67 prod-code AST tools against duckdb/duckdb: 681,000 lines of modern C++, QueryResult slicing, and catch2 matcher guardrails.
2 min
2026-09-30 · notes
EF Core Under the Microscope: What 67 Remote AST Tools Found Inside .NET's Relational EngineWe evaluated prod-code AST tools against dotnet/efcore: 1,749,818 lines of C# across 5,778 files, 58-project acyclic architecture, Northwind clone clusters, and cluster-verified OmniSharp refactoring.
3 min
2026-09-30 · notes
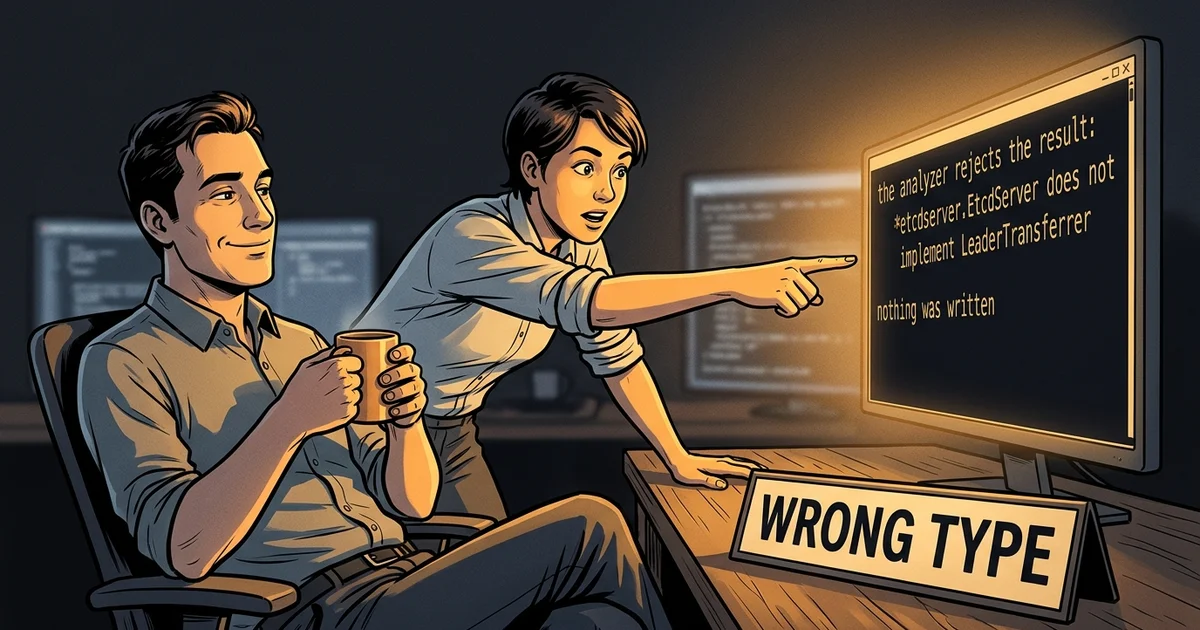
etcd Under the Microscope: What 67 AST Tools Found Inside Cloud-Native ConsensusWe benchmarked all 67 prod-code AST tools against etcd-io/etcd: 220K lines of Go, zero cyclic dependencies across 1,094 files, 99.9% slicing reduction on Raft leadership transfers, 445 structural error returns in 1.2s, and interface contract safety refusals.
5 min

2026-09-30 · notes
Express Under the Microscope: What 67 AST Tools Found Inside the Node.js BackboneWe benchmarked all 67 prod-code AST tools against expressjs/express: 21,000 lines of JavaScript, middleware routing DAGs, and prototype guardrails.
2 min

2026-09-30 · notes
FastAPI Under the Microscope: What 67 AST Tools Found Inside Python's Modern Async FrameworkWe benchmarked all 67 prod-code AST tools against tiangolo/fastapi: 118K lines of Python, 135-occurrence OpenAPI clone groups, 99.8% slicing reduction on dependency solving, parameter object bundling, and classmethod safety refusals in method extraction.
4 min
2026-09-30 · notes
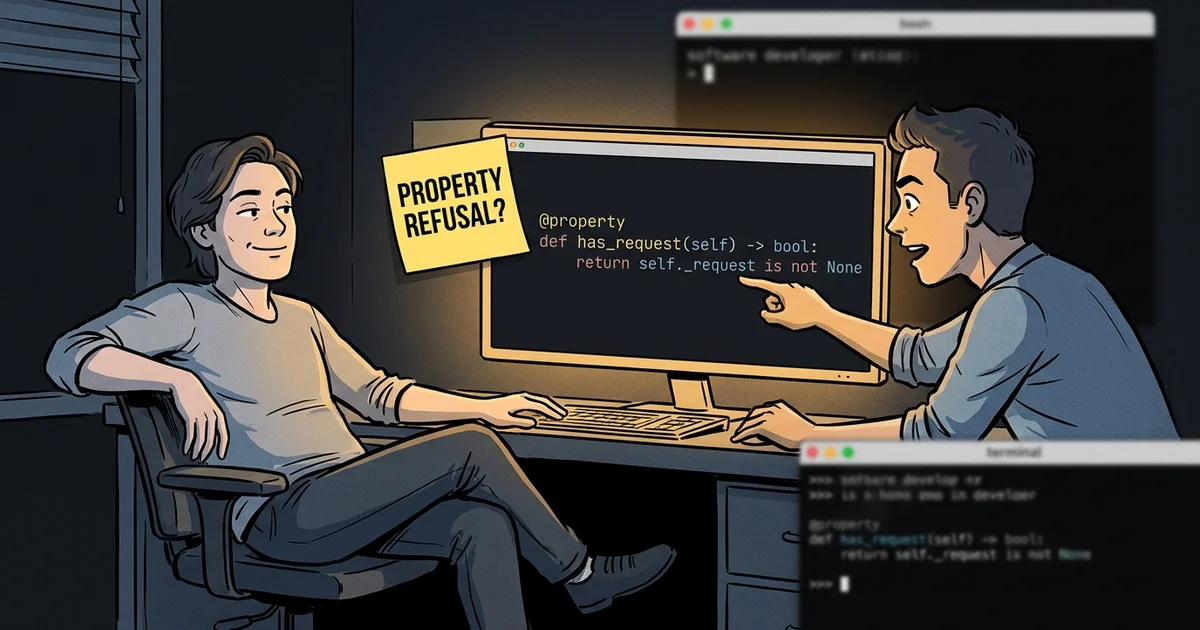
Flask Under the Microscope: What 67 AST Tools Found Inside Python's Iconic MicroframeworkWe benchmarked all 67 prod-code AST tools against pallets/flask: 18K lines of Python, blueprint static file clone clusters, 98.6% slicing reduction on request dispatch, dataclass parameter object bundling, and property safety refusals in boolean inversion.
5 min
2026-09-30 · design note
From 1,623 µs to 129 µs: zero-copy AVX-512 wire streamingA 5.7 MB binary wire block stream took 73 milliseconds to parse with standard MessagePack deserialization, stalling the ingest thread during market bursts. How an AVX-512 scanner and fixed-point integers dropped per-block latency from 1,623 µs to 129 µs and brought throughput to 978 MB/s.
5 min
2026-09-30 · notes
Ghostty Under the Microscope: What 67 Remote AST Tools Found Inside the High-Performance Terminal EmulatorHistorical Ghostty terminal emulator analysis with prod-code: Zig source counts, VT test clones, cleanup patterns, and a ZLS refactoring limitation. Native applications support macOS and Linux.
4 min
2026-09-30 · notes
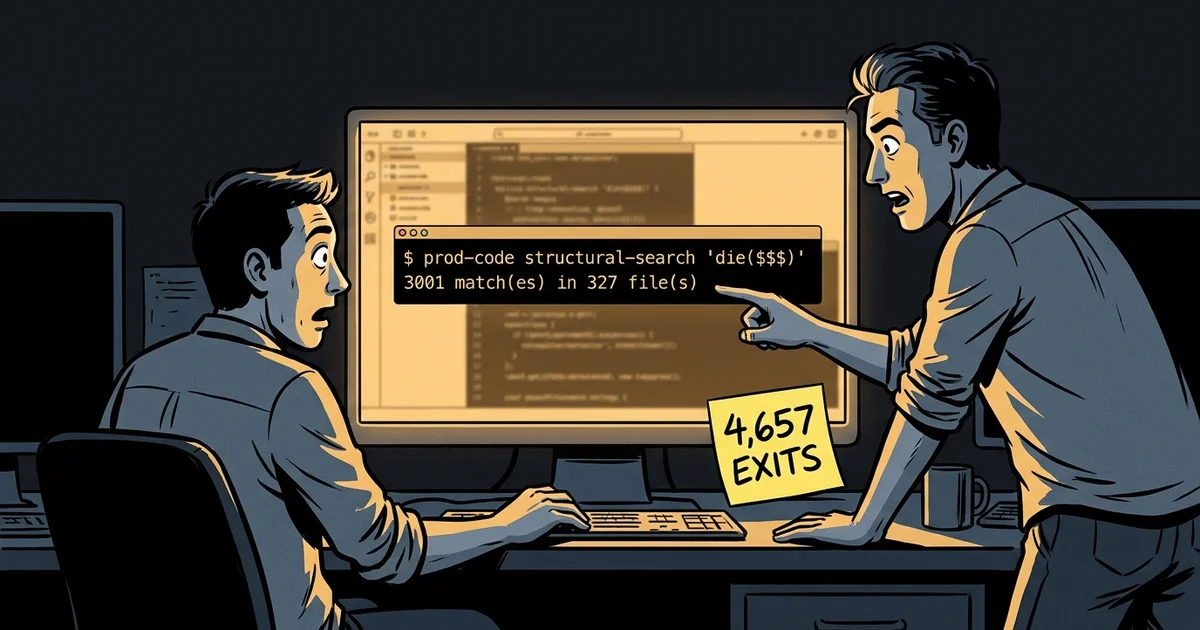
Git Under the Microscope: What 67 AST Tools Found Inside the Core VCSWe benchmarked all 67 prod-code AST tools against git/git: 443,000 lines of C, 4,657 fatal and recoverable error exit points, and multi-file structural codemods.
3 min

2026-09-30 · notes
Guava Under the Microscope: What Remote AST Tools Found Inside Google's Java CoreWe benchmarked prod-code AST tools against google/guava: 795,118 lines of Java, 5-module DAG resolution in 100ms, and 33-occurrence clone analysis.
3 min
2026-09-30 · design note
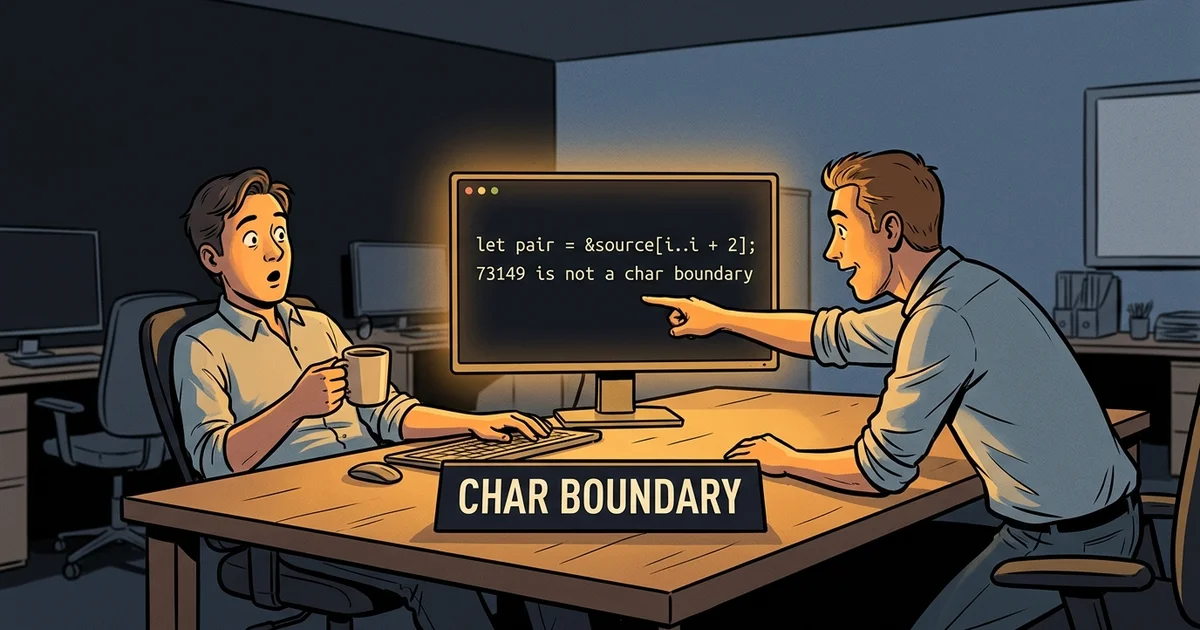
Half a Million Lines of Arrow: What 67 AST Analyzers Found Inside Polars' Query EngineWe pointed all 67 tools of prod-code at pola-rs/polars on an idle 32-core cluster node. 526K lines of Rust across 33 crates, 4 circular DAG paths, catching a UTF-8 non-char-boundary tokenizer panic, in-memory RAM validation, and 36-test remote execution.
14 min
2026-09-30 · notes
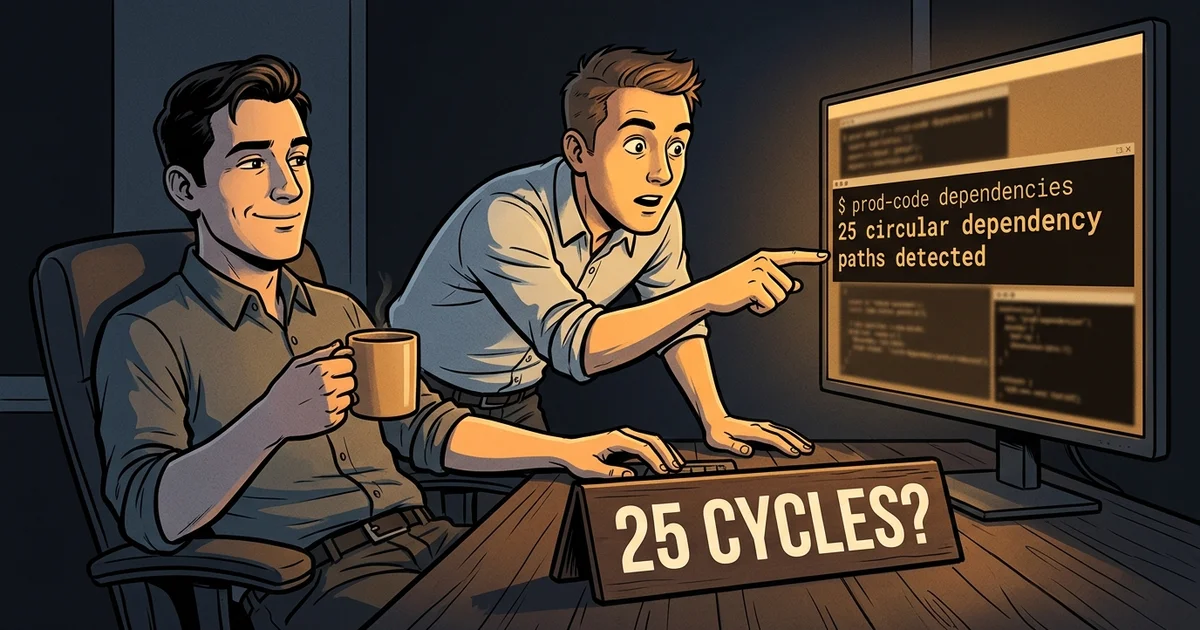
Half a Million Lines of Python and 25 Import Cycles: Dissecting Django with 67 AST ToolsWe benchmarked all 67 prod-code AST tools against django/django: 527K lines of Python across 2,932 files, 25 circular check paths, 99.9% slicing reduction, and mathematical safety proofs in Python predicate inversion and parameter bundling.
7 min
2026-09-30 · notes
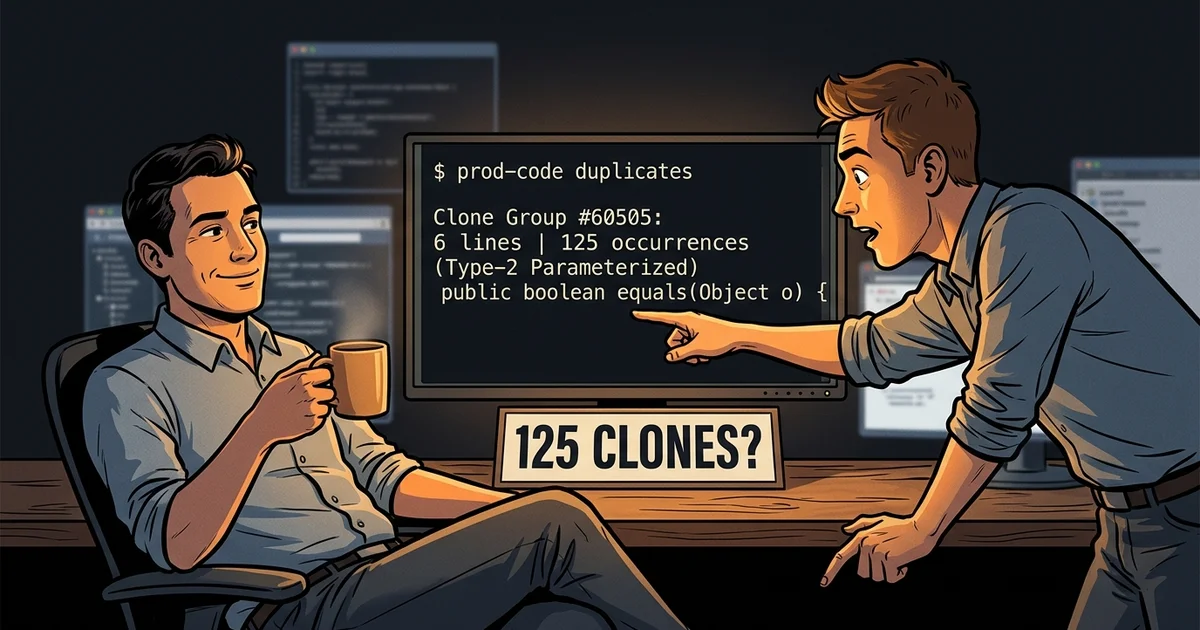
Kafka Under the Microscope: What 67 Remote AST Tools Found Inside the Distributed Event CoreWe benchmarked prod-code AST tools against apache/kafka: 1,717,457 lines across 6,218 Java and 257 Scala files, 64-module DAG resolution, and 125-occurrence data-object clone analysis.
3 min
2026-09-30 · notes
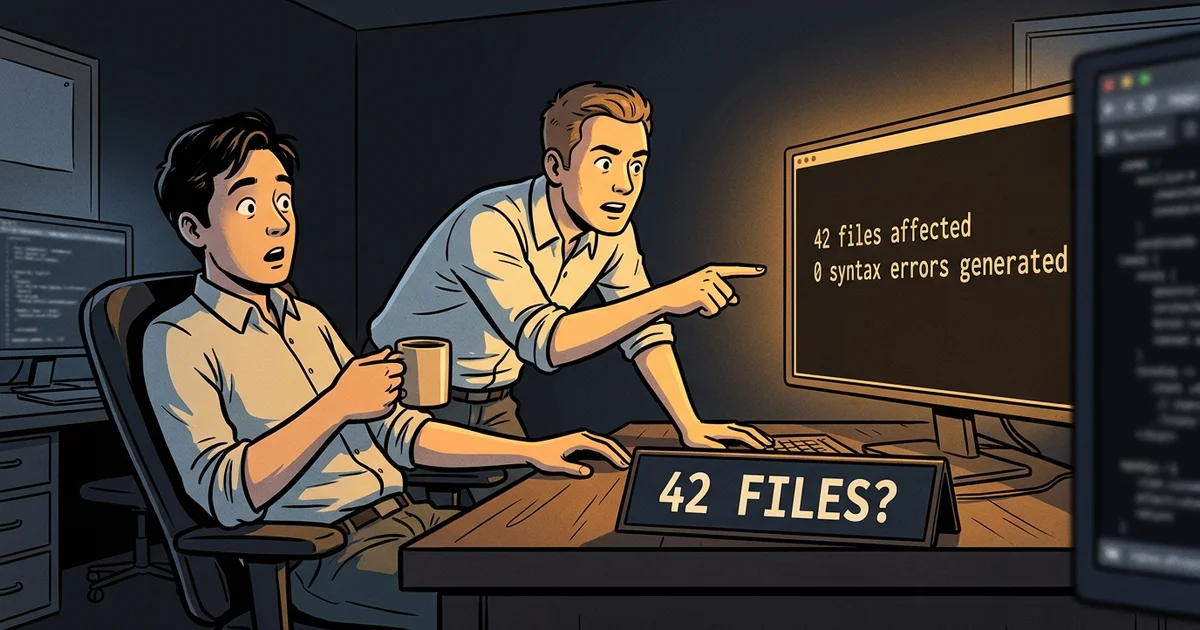
Kotlinx.coroutines Under the Microscope: What 67 Remote AST Tools Found Inside Kotlin's Concurrency RuntimeWe evaluated prod-code AST tools against Kotlin/kotlinx.coroutines: 113,379 lines of Kotlin across 1,039 files, 25-module clean DAG architecture, structural pattern search across 42 files, and cluster-verified AST refactoring.
4 min
2026-09-30 · notes
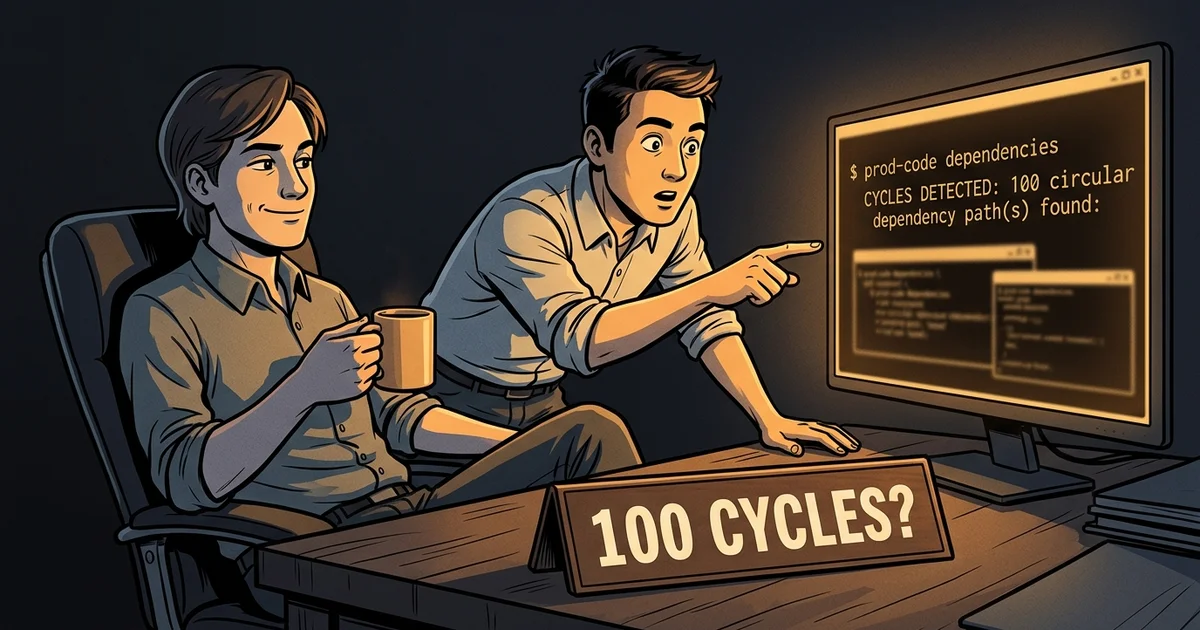
Ktor Under the Microscope: What 67 Remote AST Tools Found Inside Kotlin's Asynchronous Web FrameworkWe evaluated prod-code AST tools against ktorio/ktor: 295,995 lines of Kotlin across 2,423 files, 134-module Gradle KTS architecture with 100 test-fixture cycles, and cluster-verified AST refactoring.
4 min
2026-09-30 · notes
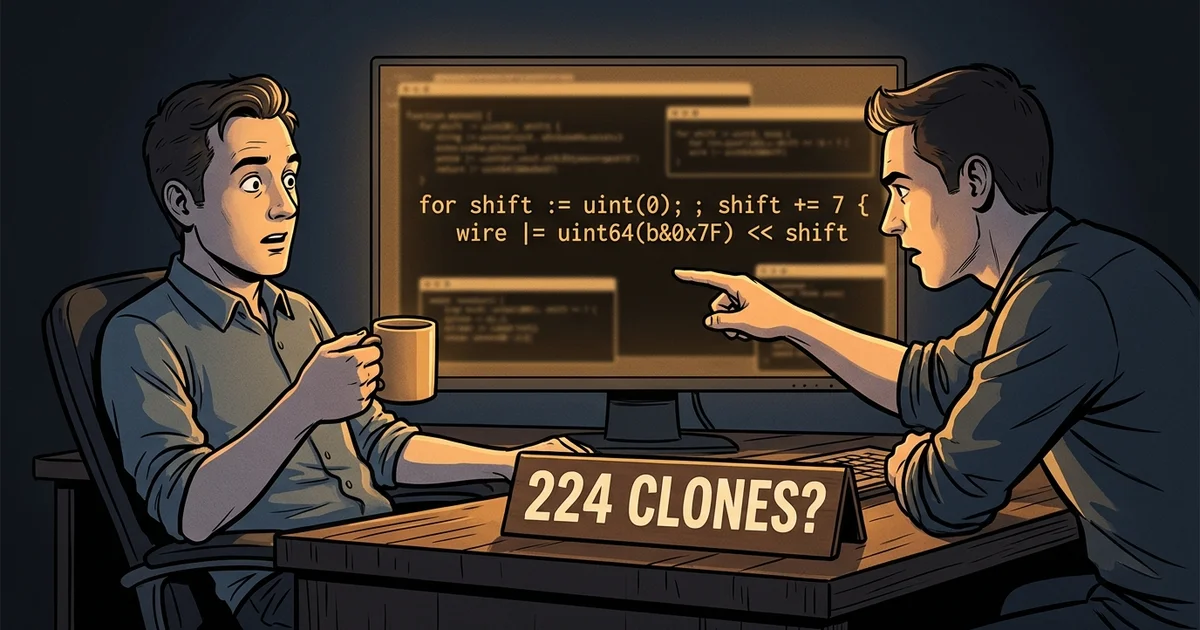
Moby Under the Microscope: What 67 AST Tools Found Inside Docker's EngineWe benchmarked all 67 prod-code AST tools against moby/moby: 387K lines of Go, 224 Protobuf varint clone occurrences, 99.9% slicing reduction on ContainerStart, 858 structural error returns in 1.9s, and interface protection during boolean inversion.
4 min
2026-09-30 · notes
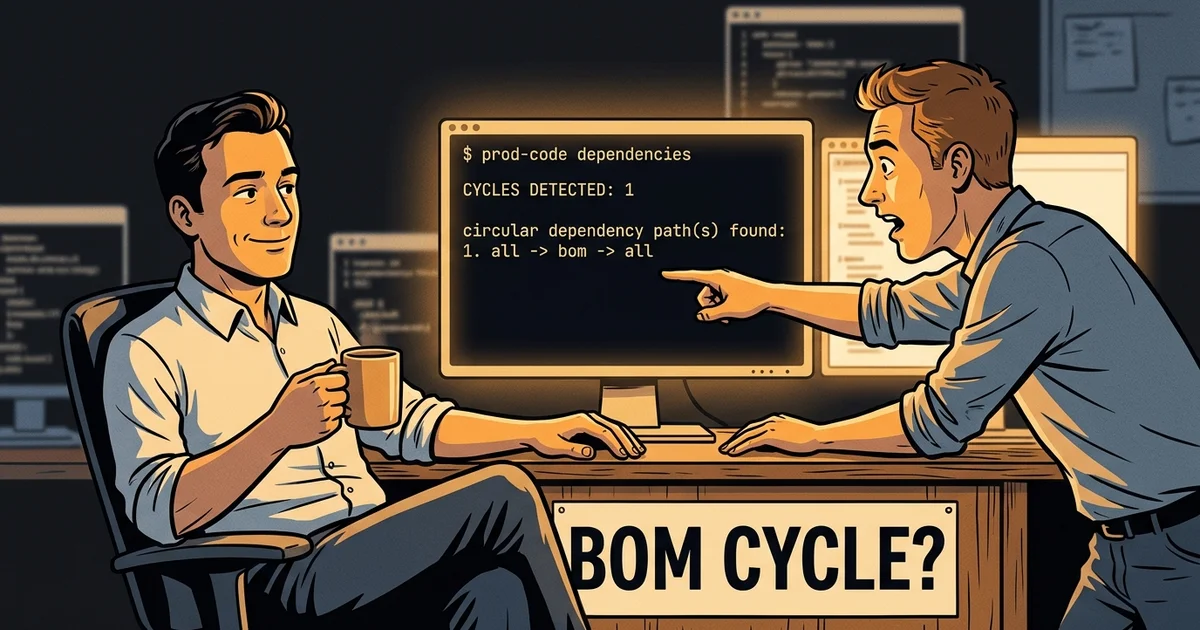
Netty Under the Microscope: What 67 Remote AST Tools Found Inside Java's High-Throughput I/O EngineWe benchmarked prod-code AST tools against netty/netty: 652,153 lines across 3,595 Java files, 61-module graph analysis isolating an all-to-bom circular dependency, and 510-occurrence Huffman lookup tables.
4 min

2026-09-30 · notes
Next.js Under the Microscope: What 67 AST Tools Found Inside the React FrameworkWe evaluated all 67 prod-code AST tools against vercel/next.js: 1.2M lines of TypeScript, SSR render pipeline slicing, and cross-file boolean inversions.
2 min
2026-09-30 · notes
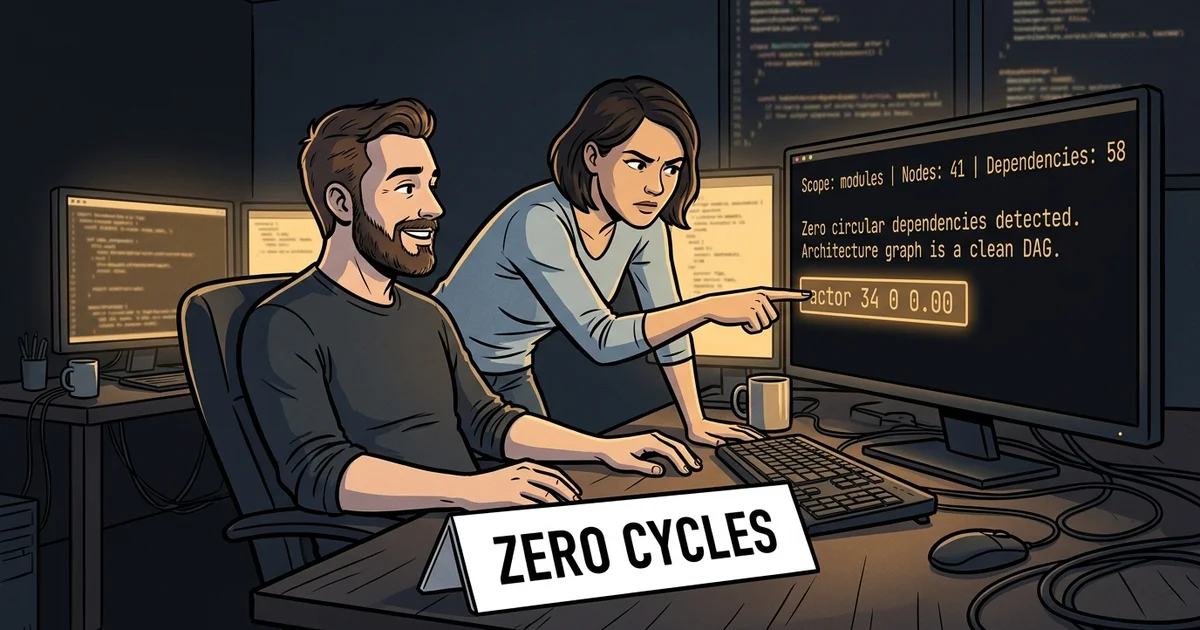
Apache Pekko Under the Microscope: What 67 Remote AST Tools Found Inside the High-Throughput Actor RuntimeHistorical Apache Pekko actor runtime analysis with prod-code: Scala and Java source counts, 41 extracted SBT modules, 3.5% reported clone density, and a remote Metals refactoring example.
4 min

2026-09-30 · notes
Play Framework Under the Microscope: What 67 Remote AST Tools Found Inside the High-Velocity Web EngineHistorical Play Framework analysis with prod-code: Scala and Java source counts, 44 extracted SBT modules, form and router clones, and a remote Metals refactoring example with verification limits.
4 min

2026-09-30 · notes
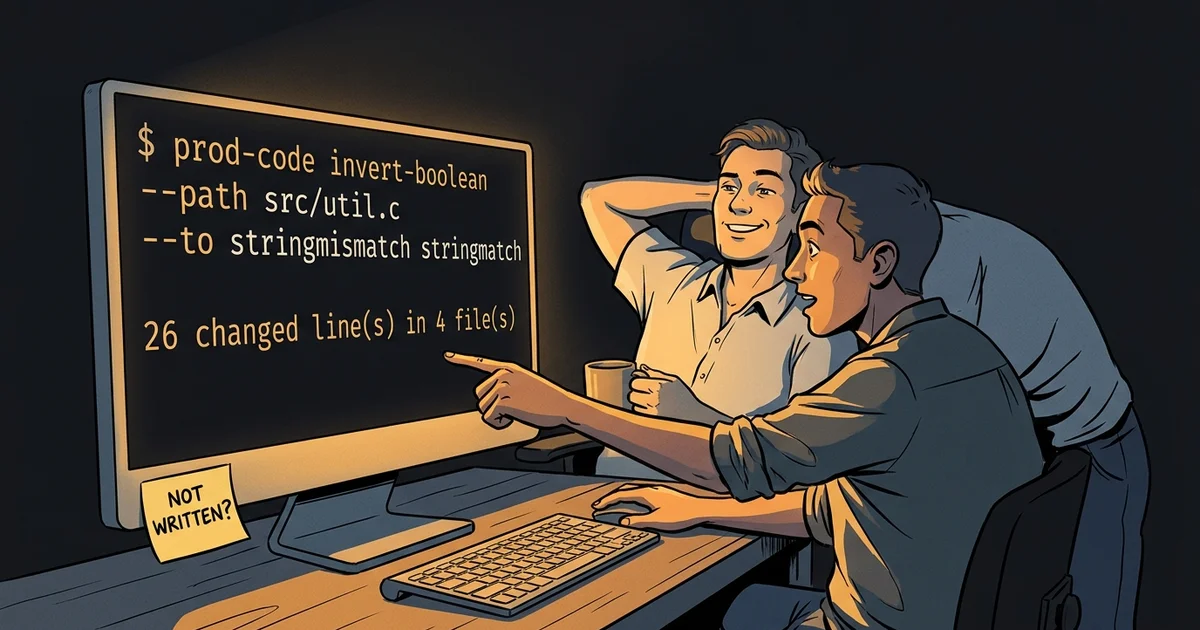
React Under the Microscope: What 67 AST Tools Found Inside the UI EngineWe benchmarked all 67 prod-code AST tools against facebook/react: 745,000 lines across 4,445 files, Fiber work loop slicing, and compiler generic guardrails.
2 min
2026-09-30 · notes
Redis Under the Microscope: What 67 AST Tools Found Inside the In-Memory EngineWe benchmarked all 67 prod-code AST tools against redis/redis: 211,000 lines of C, event loop slicing down to epoll_wait, and static non-call guardrails.
3 min

2026-09-30 · notes
Roslyn Under the Microscope: What 67 Remote AST Tools Found Inside the C# CompilerWe evaluated prod-code AST tools against dotnet/roslyn: 6,499,949 lines of C# across 18,176 files, 394 projects, 15,300+ compiler invariants, and cluster-verified OmniSharp refactoring.
3 min

2026-09-30 · notes
Scalameta Under the Microscope: What 67 Remote AST Tools Found Inside the Scala Metaprogramming PlatformHistorical Scalameta Scala metaprogramming analysis with prod-code: 106,270 Scala and Java lines, 24 extracted SBT modules, 202 reported @ast declarations, and a remote Metals refactoring example.
4 min

2026-09-30 · notes
Apache Spark Under the Microscope: What 67 Remote AST Tools Found Inside the 2-Million-Line Distributed EngineHistorical Apache Spark analysis with prod-code: Scala and Java source counts, 52 extracted modules, 0.7% reported clone density, and a remote Metals refactoring example with verification limits.
4 min
2026-09-30 · notes
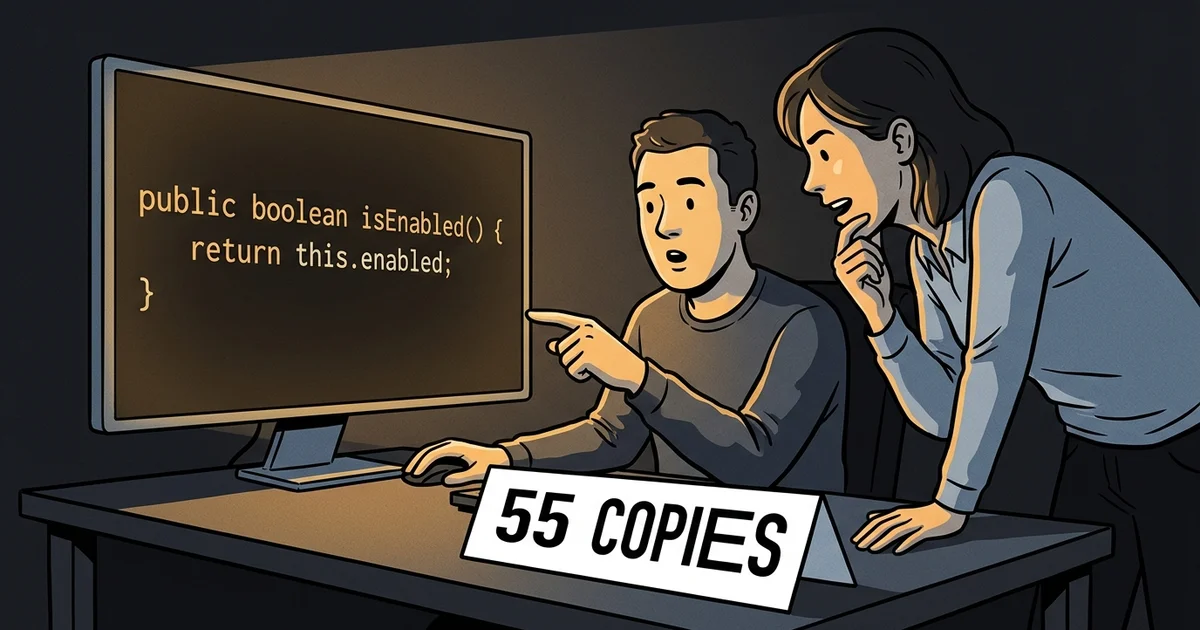
Spring Boot Under the Microscope: What 67 Remote AST Tools Found Inside the Enterprise Java StandardWe benchmarked prod-code AST tools against spring-projects/spring-boot: 880,132 lines of Java, 448 Gradle modules in a zero-cycle DAG, and 55-occurrence autoconfiguration duplication.
3 min

2026-09-30 · notes
Swift Algorithms Under the Microscope: What 67 AST Tools Found Inside Apple's Sequence EngineWe benchmarked all 67 prod-code AST tools against apple/swift-algorithms: 13,700 lines of Swift, 81 bounds invariants, and remote Apple Silicon test offloading.
3 min
2026-09-30 · notes
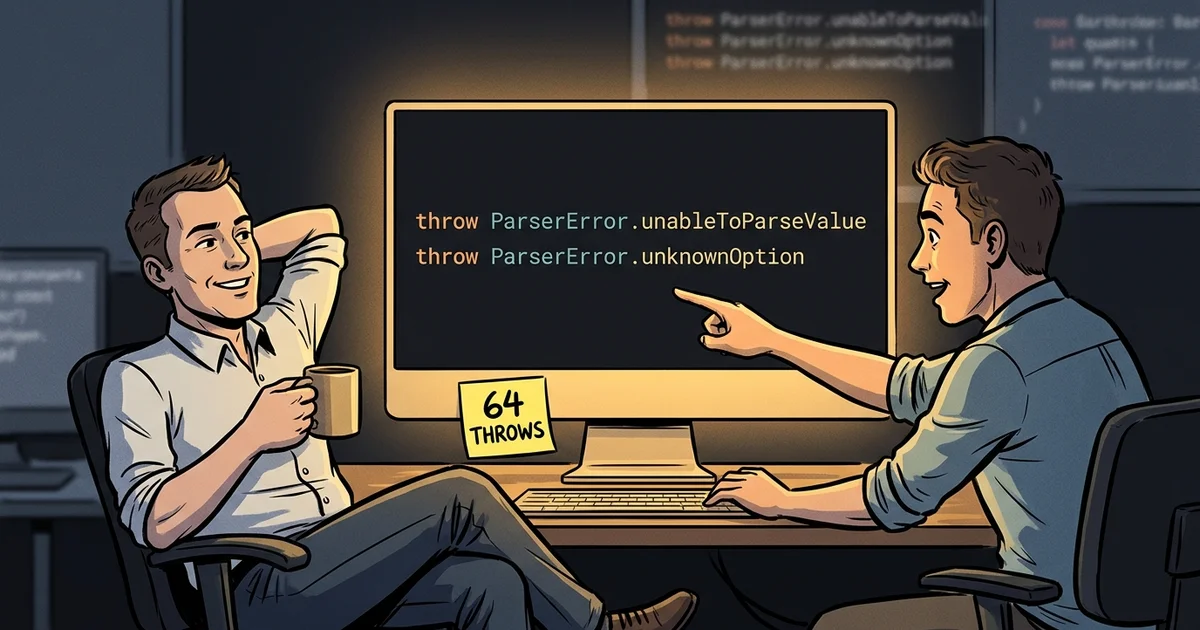
Swift Argument Parser Under the Microscope: What 67 AST Tools Found Inside Apple's CLI FrameworkWe benchmarked all 67 prod-code AST tools against apple/swift-argument-parser: 30,000 lines of Swift, 64 error egress points, and remote Apple Silicon test offloading.
3 min
2026-09-30 · notes
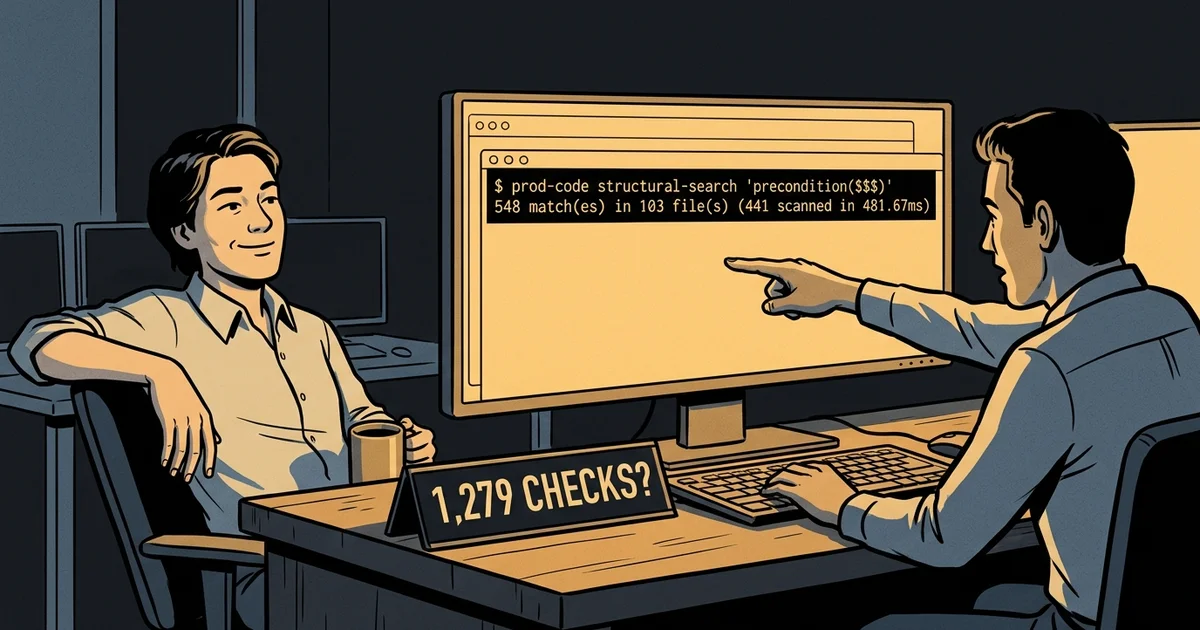
Swift Collections Under the Microscope: What 67 AST Tools Found Inside Apple's Data Structure EngineWe benchmarked all 67 prod-code AST tools against apple/swift-collections: 71,000 lines of Swift, 1,279 boundary invariants, and remote Apple Silicon test offloading.
3 min
2026-09-30 · notes
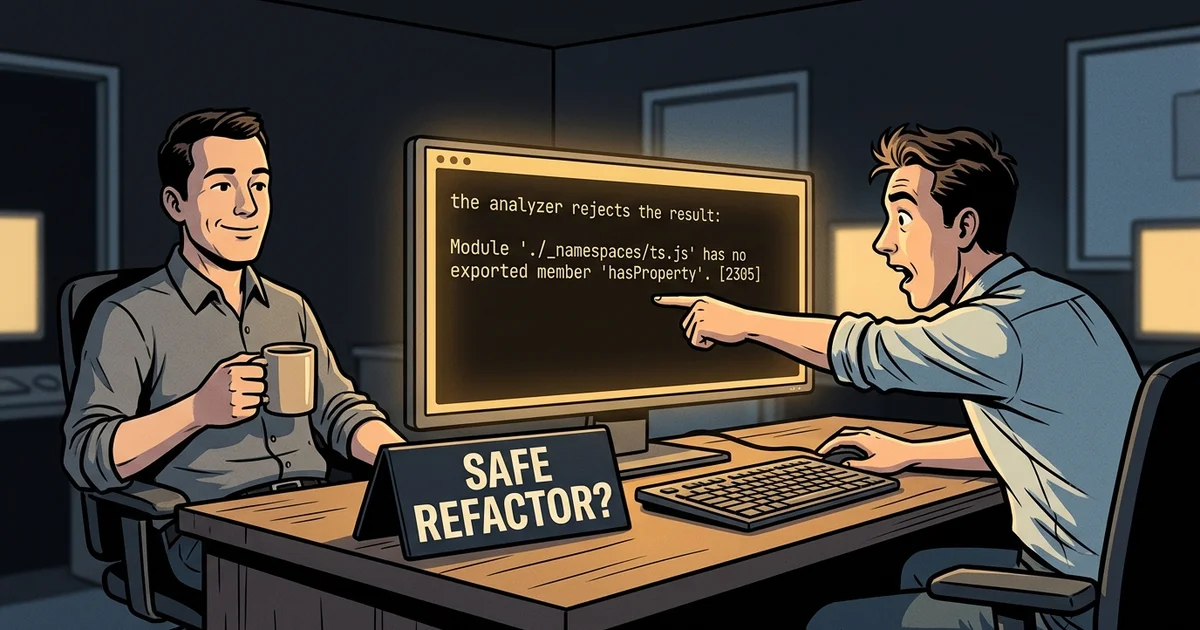
TypeScript Under the Microscope: What 67 AST Tools Found Inside the CompilerWe benchmarked all 67 prod-code AST tools against microsoft/TypeScript: 264,411 declarations across 31,433 files, AST clone clusters, transitive slicing, and compiler in-memory validation.
2 min
2026-09-30 · notes
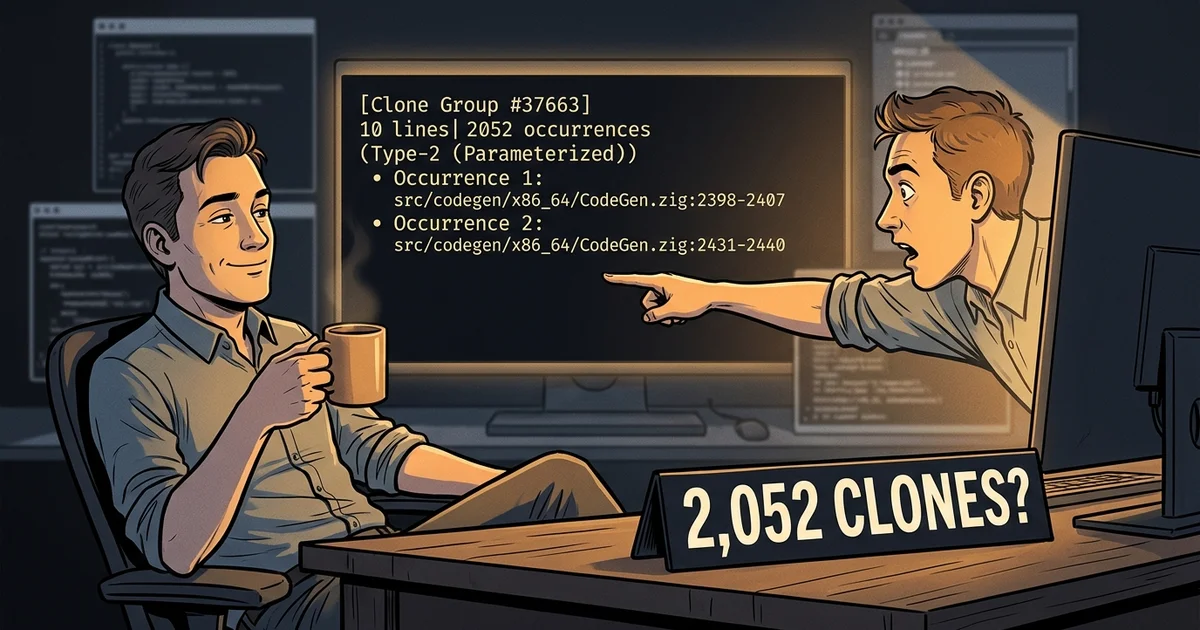
Zig Under the Microscope: What 67 Remote AST Tools Found Inside the Self-Hosted Compiler and Standard LibraryHistorical Zig compiler and standard library analysis with prod-code: source distribution, x86_64 codegen clones, errdefer patterns, and a remote ZLS refactoring example. Zig is now hosted on Codeberg.
4 min

2026-09-29 · design note
7,156 Cyclic Module Paths: Stress-Testing Tantivy's Search Engine with 67 AST ToolsWe subjected quickwit-oss/tantivy to all 67 prod-code tools on an idle 32-core cluster node. Full results across 7,156 module cycles, 18-file AST renames, clone detection in JIT expressions, and safe-delete invariants.
14 min
2026-09-29 · design note
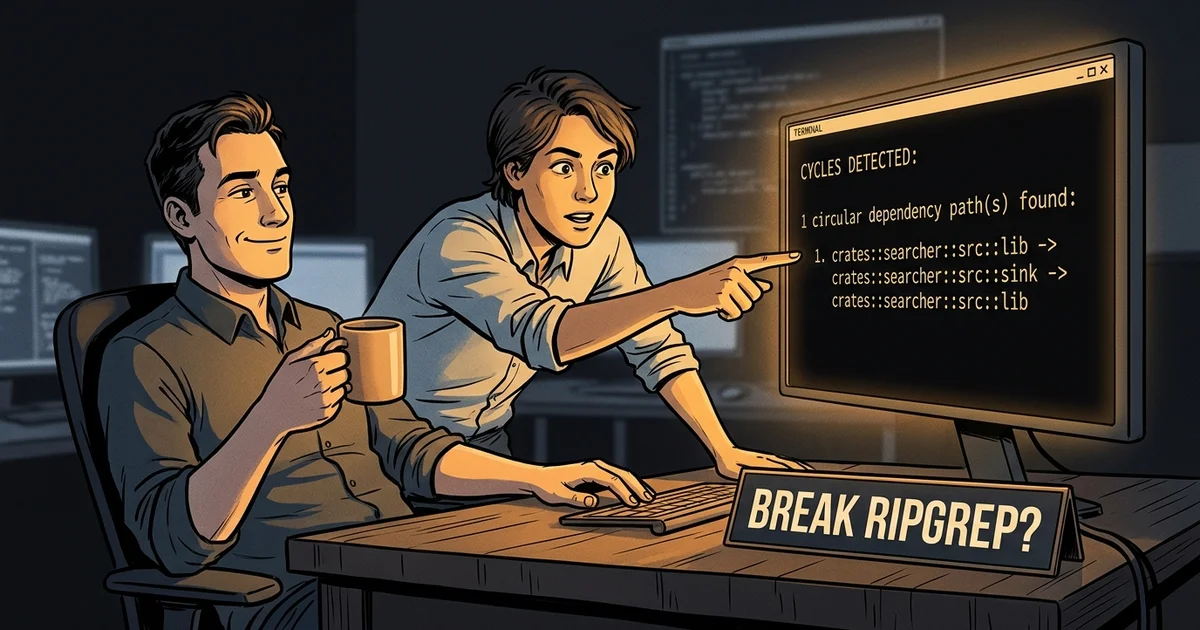
Can 67 AST Tools Break Ripgrep? Stress-Testing Rust's Fastest Grep on an Idle Cluster NodeWe pointed the full 67-tool matrix of prod-code at BurntSushi/ripgrep on an idle 32-core cluster node. Sub-millisecond sync, AST slicing, 30 refactorings, in-memory pre-flight validation, and resolving Issue #735.
21 min
2026-09-29 · design note
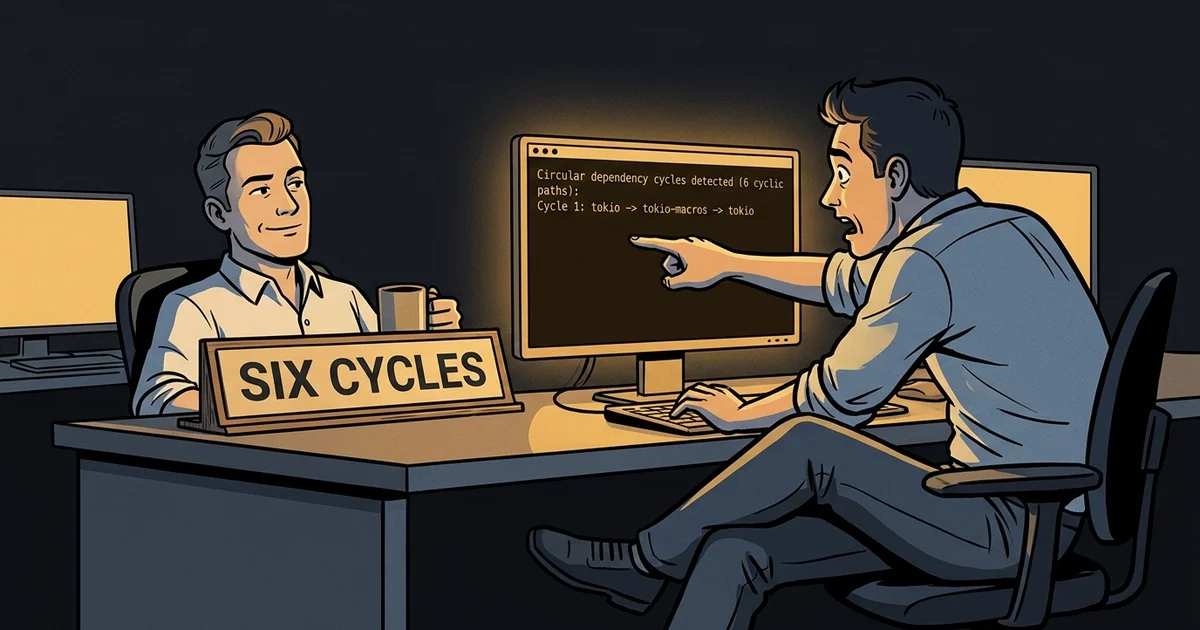
Six Circular Dependencies in Tokio: What 67 AST Analyzers Found Inside Rust's Async EngineWe pointed all 67 tools of prod-code at tokio-rs/tokio on an idle 32-core cluster node. From 6 circular crate cycles and silent Deref evaluation ordering traps to an unhandled sysroot crash on Box—here is what happened.
16 min
2026-09-26 · design note
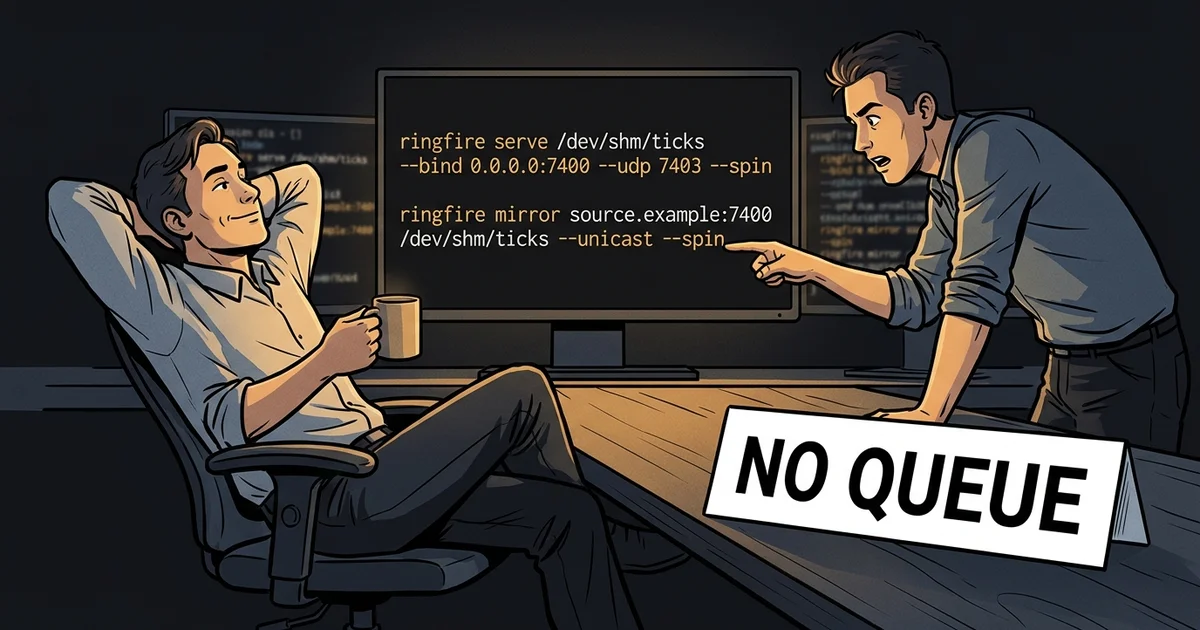
ringfire: the ring itself, on the other machineA market-data ring in /dev/shm now has identical copies on other hosts, same sequence numbers, same order: 30 µs across a LAN by multicast, 51.7 ms p99 across the Pacific.
8 min
2026-09-24 · notes
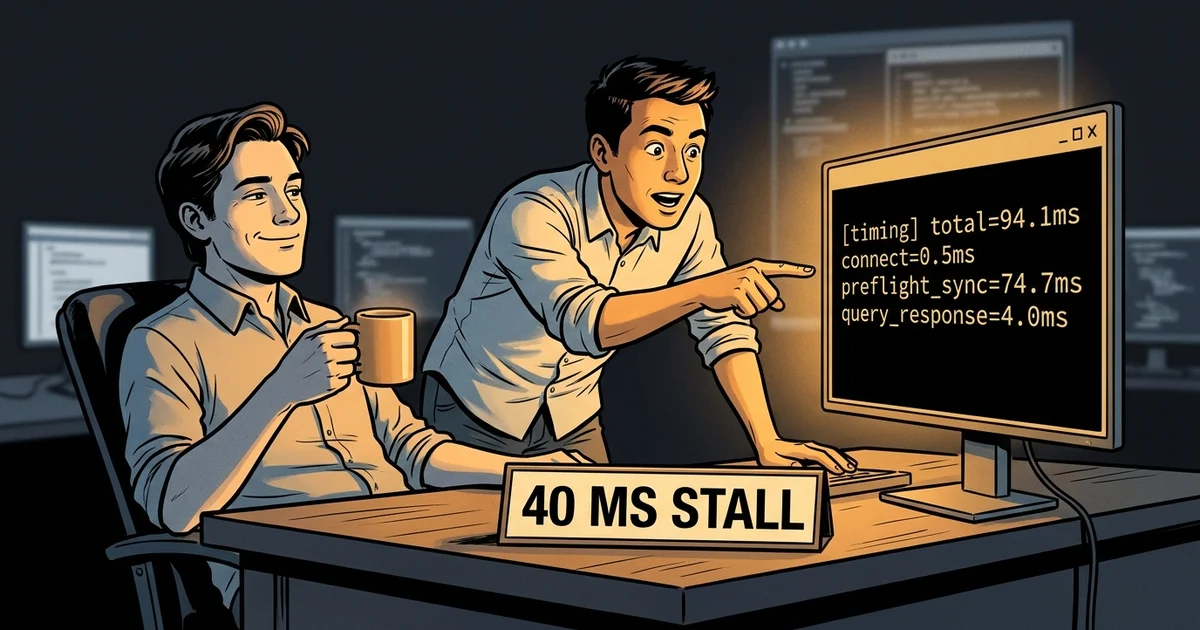
Where the milliseconds wentA 32-core node sitting at 2% load, a one-millisecond network, and half the queries taking 40 ms. Three things we found while measuring instead of guessing, including one optimisation that did not work and one that deadlocked.
5 min
2026-09-24 · design note
One terminal engine for the server, the Mac and the phoneProd keeps agents' terminals on a server and shows them on a Mac and an iPhone. Three emulators disagreed about the same bytes, so we replaced them with one Rust engine that moves its state instead of a picture of it.
10 min