
Category
notes
2026-10-02 · notes
Outside any functionIn a mixed Go/JavaScript checkout, impact analysis reported zero changed functions and claimed every edit fell outside all functions. Why root manifests blind polyglot analyzers, how arrow functions hide from LSP kinds, and why missing symbols must be a gap rather than a verdict.
2 min
2026-10-02 · notes
Sharing rust-analyzer across Git worktrees: in-memory overlay architecture and concurrency lessonsIn a multi-agent coding fleet, running separate rust-analyzer instances for every Git worktree multiplies memory consumption. Here is how an in-memory VFS overlay shares a single analysis database across worktrees, the Salsa concurrency traps we encountered, and our proposal to upstream.
4 min
2026-10-01 · notes
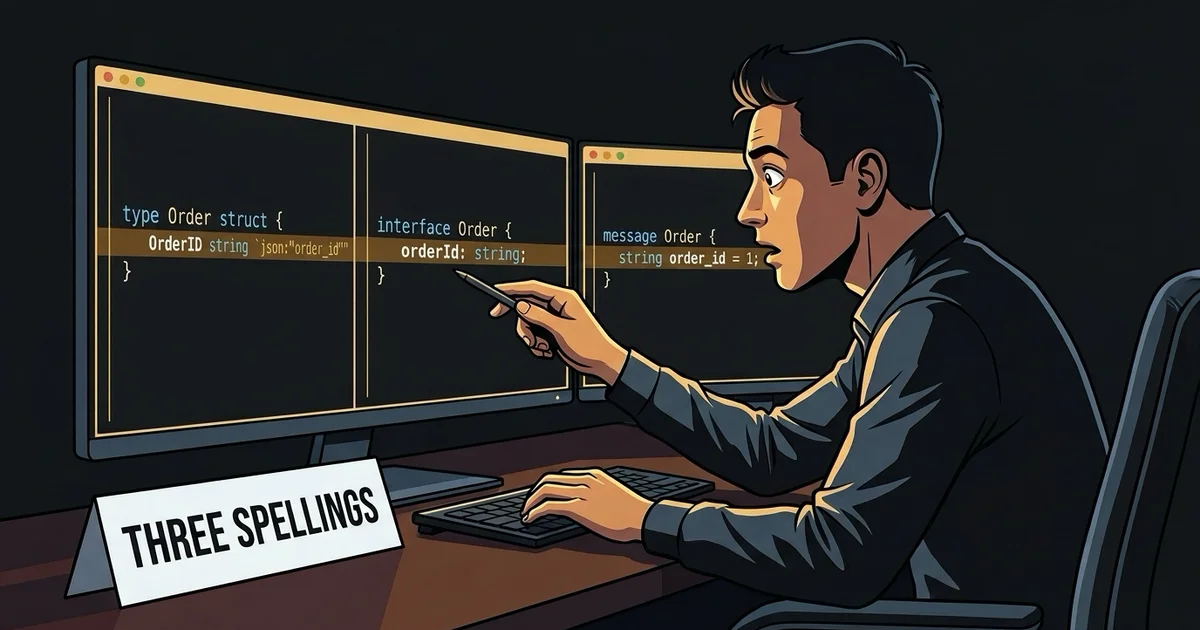
One field, three spellingsCross-language schema rename needs semantic edits for identifiers and separate text edits for wire names. A polyglot fixture shows how prod-code plans the change, validates it, and reports what remains.
6 min
2026-09-30 · notes
The refactor no tool ownsRename is everywhere; changing what a function takes is nowhere. Building it meant letting the declaration write the rule, checking the result against the analyzer's own reference list, and refusing to write anything that does not compile.
5 min
2026-09-30 · notes
1,485 Error Checks and Zero Import Cycles: Dissecting Prometheus's 84-Package Engine with 67 AST ToolsWe benchmarked all 67 prod-code AST tools against prometheus/prometheus: 385K lines of Go, 84 packages, 1,485 error checks, 99% slicing reduction, and Bug #740 fixed in remote module dependencies.
9 min
2026-09-30 · notes
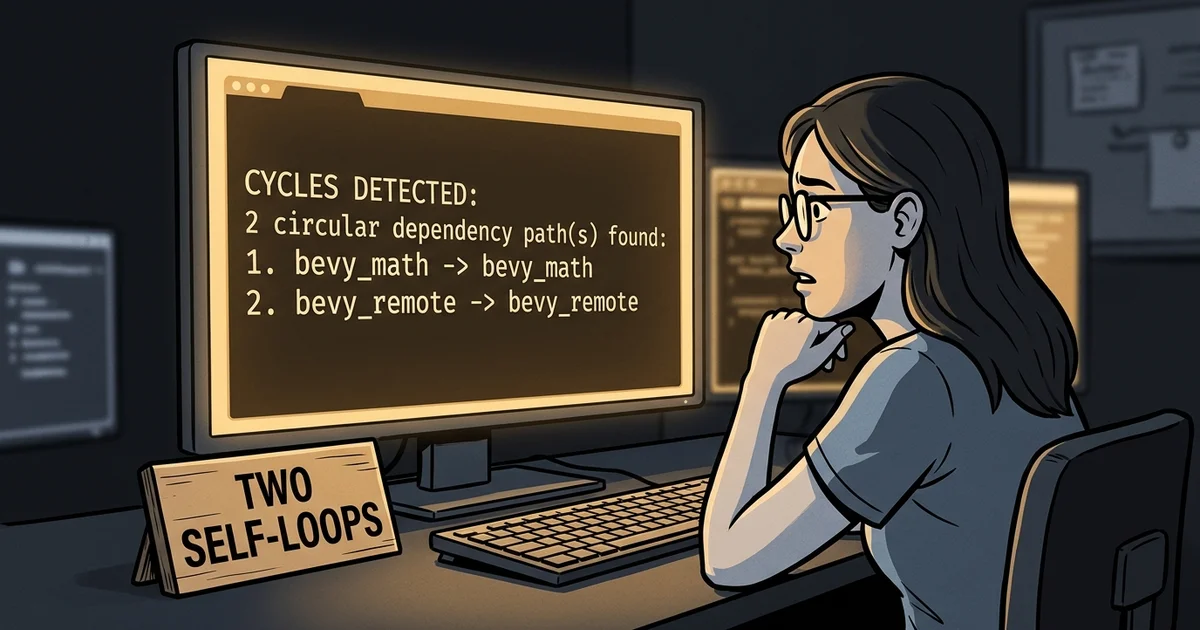
204 Code Clones and Two Self-Loops: Dissecting Bevy's 97-Crate Engine with 67 AST ToolsWe benchmarked all 67 prod-code AST tools against bevyengine/bevy: 661K lines of Rust, 97 crates, 204 exact code clones, 2 dev-dependency loops, and Bug #739 discovered and fixed in fast-sync.
9 min
2026-09-30 · notes
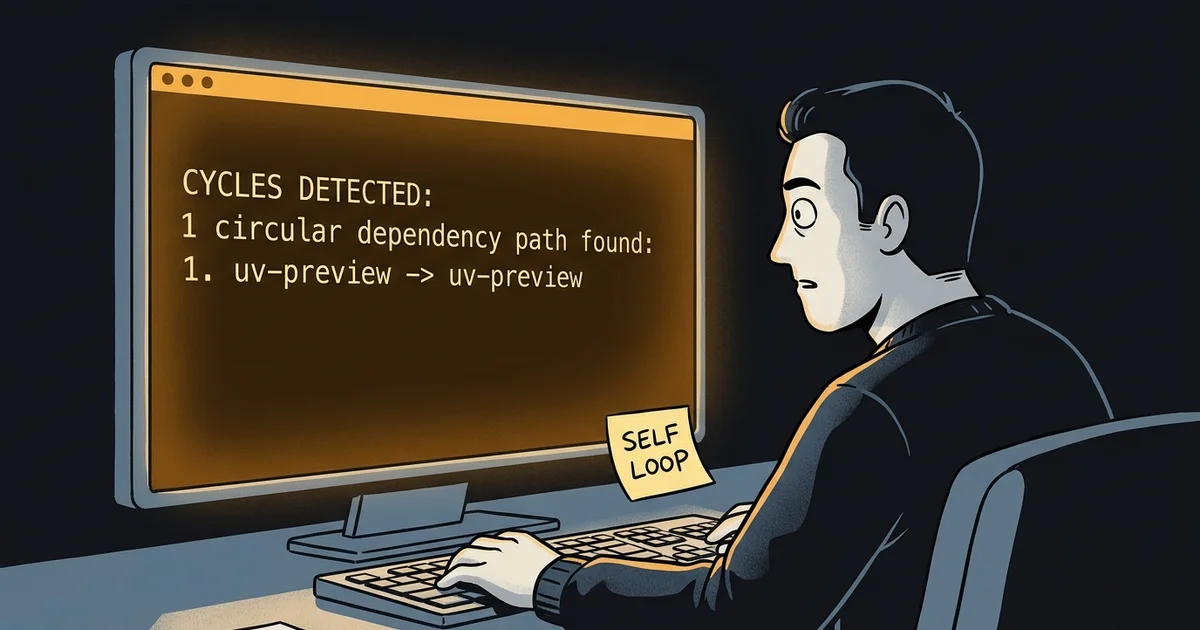
347 Code Clones and a Self-Loop: Breaking Down uv's 74-Crate Workspace with 67 AST ToolsWe benchmarked all 67 prod-code AST tools against astral-sh/uv: 559K lines of Rust, 74 crates, 347 duplicated test clones, a self-referential cycle in uv-preview, and Issue #738 resolved in fast-sync.
10 min
2026-09-30 · notes
5.3 Million Lines of Go and 779 Packages: Dissecting Kubernetes with 67 AST ToolsWe benchmarked all 67 prod-code AST tools against kubernetes/kubernetes: 5.38M lines of Go across 17,823 files, 779 packages, 0% laptop CPU, and fixed Bugs #741 and #742 in Go signature compilation and predicate inversion.
9 min
2026-09-30 · notes
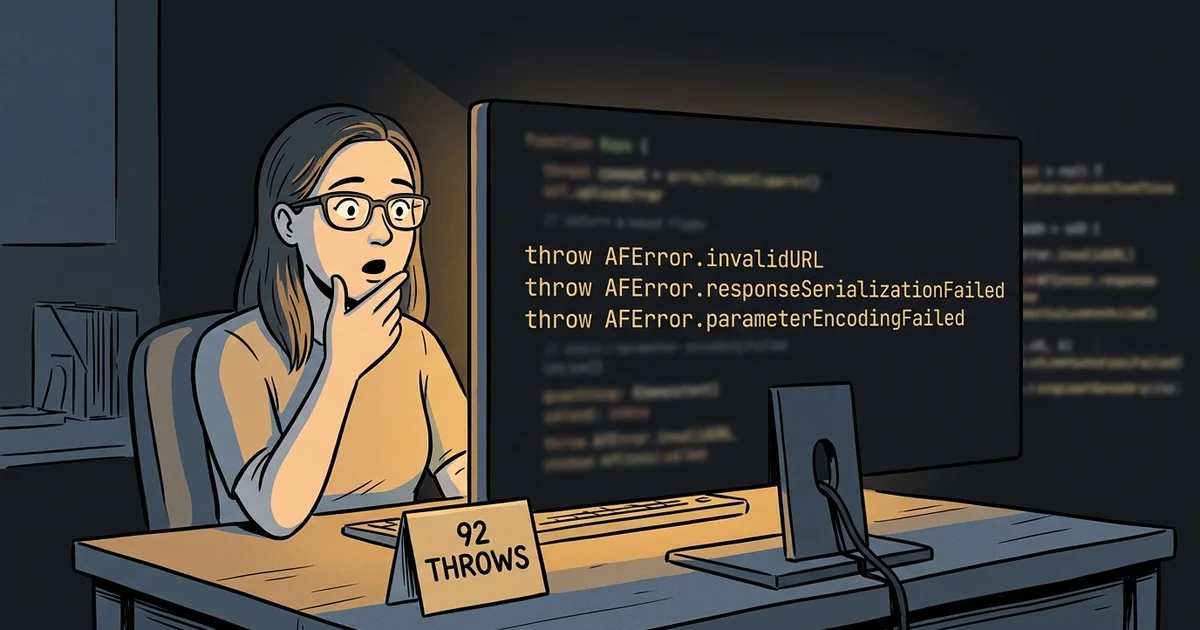
Alamofire Under the Microscope: What 67 AST Tools Found Inside the Swift Networking EngineWe benchmarked all 67 prod-code AST tools against Alamofire: 39,000 lines of Swift, 92 error egress boundaries, 20 clone groups, and remote Apple Silicon test offloading.
3 min
2026-09-30 · notes
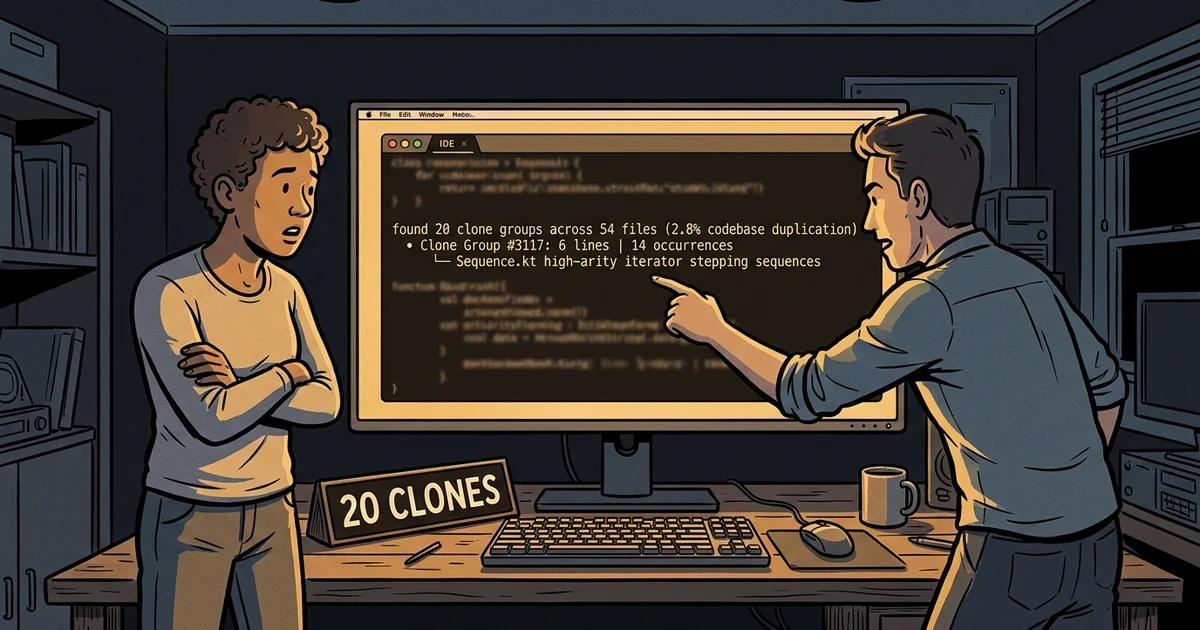
Arrow Under the Microscope: What 67 Remote AST Tools Found Inside Kotlin's Functional CoreWe evaluated prod-code AST tools against arrow-kt/arrow: 72,889 lines of Kotlin across 757 files, 38-module Gradle architecture, structural search for the Raise DSL, and cluster-verified AST refactoring.
3 min
2026-09-30 · notes
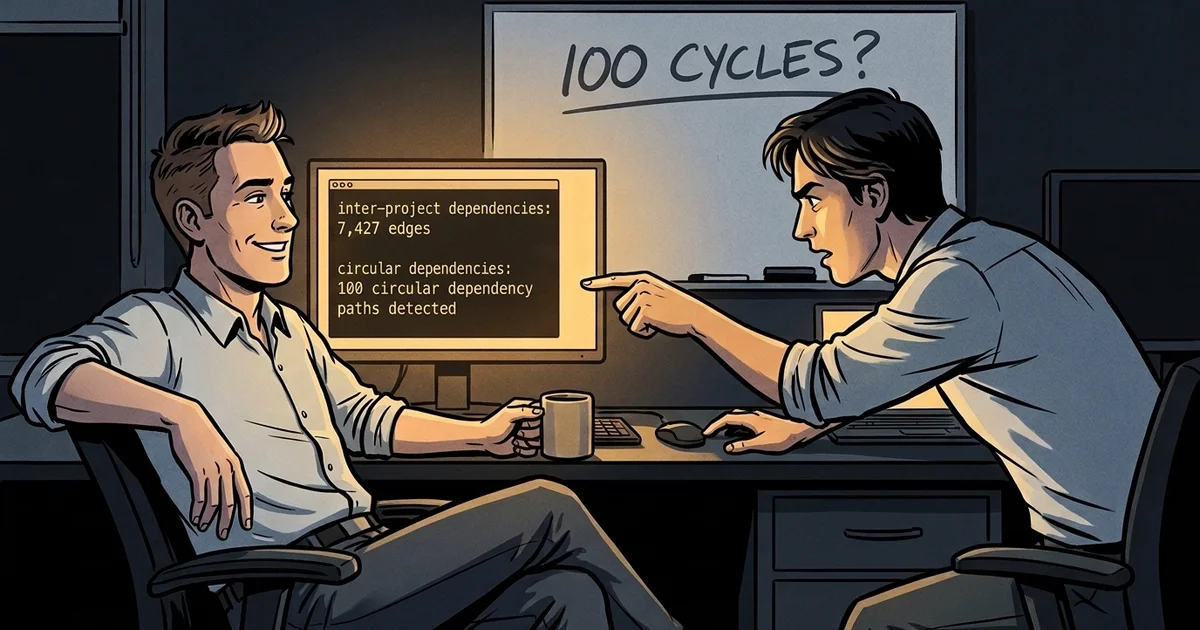
ASP.NET Core Under the Microscope: What 67 Remote AST Tools Found Inside Microsoft's Web EngineWe evaluated prod-code AST tools against dotnet/aspnetcore: 1,757,169 lines of C# across 10,685 files, 625 projects in a single repository, Roslyn generator snapshot clones, and cluster-verified OmniSharp refactoring.
3 min
2026-09-30 · notes
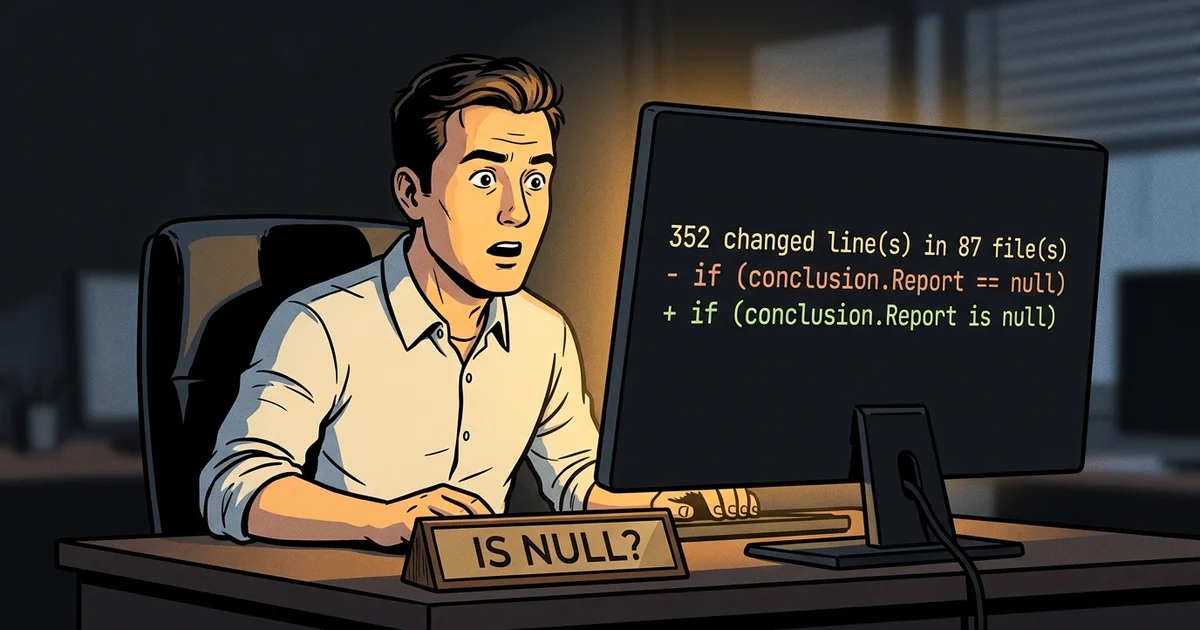
BenchmarkDotNet Under the Microscope: What 67 Remote AST Tools Found Inside the .NET Micro-Benchmarking EngineWe evaluated prod-code AST tools against dotnet/BenchmarkDotNet: 120,810 lines of C# across 1,175 files, 29 projects in an acyclic DAG, 1,120 benchmark harnesses, and cluster-verified OmniSharp refactoring.
4 min
2026-09-30 · notes
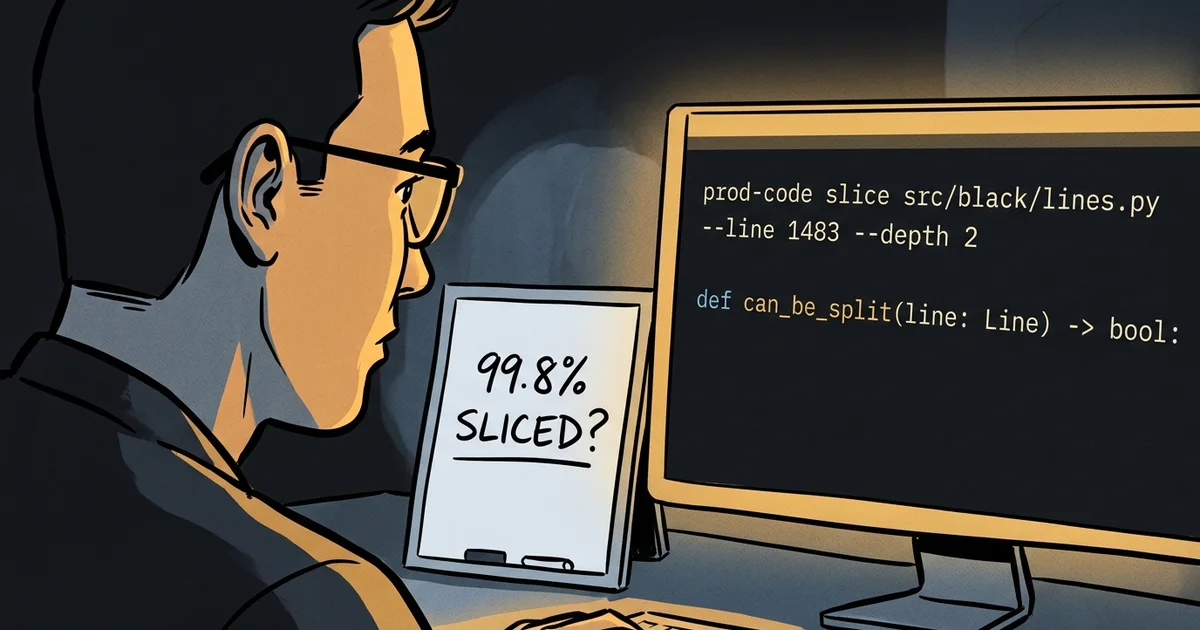
Black Under the Microscope: What 67 AST Tools Found Inside Python's Uncompromising FormatterWe benchmarked all 67 prod-code AST tools against psf/black: 135K lines of Python, 12-callsite parameter object bundling across 4 files, import cycle detection in concurrency, 99.8% slicing reduction, and mathematical safety proofs in predicate inversion.
5 min

2026-09-30 · notes
curl Under the Microscope: What 67 AST Tools Found Inside the Ubiquitous Transfer EngineWe benchmarked all 67 prod-code AST tools against curl/curl: 200,000 lines of C, 1,924 failure and diagnostic egress points, and parameterized AST codemods.
2 min
2026-09-30 · notes
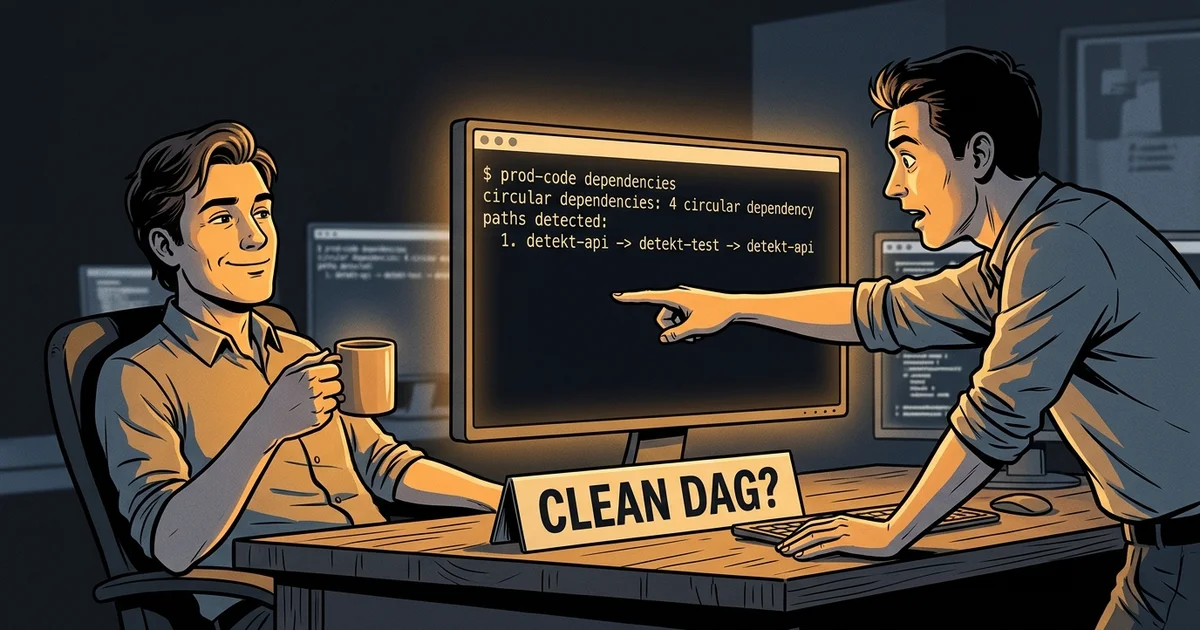
Detekt Under the Microscope: What 67 Remote AST Tools Found Inside Kotlin's Static Code AnalyzerWe evaluated prod-code AST tools against detekt/detekt: 132,028 lines of Kotlin across 1,105 files, 41-module Gradle architecture with 4 test cycles, structural search across 31 files, and cluster-verified AST refactoring.
3 min
2026-09-30 · notes
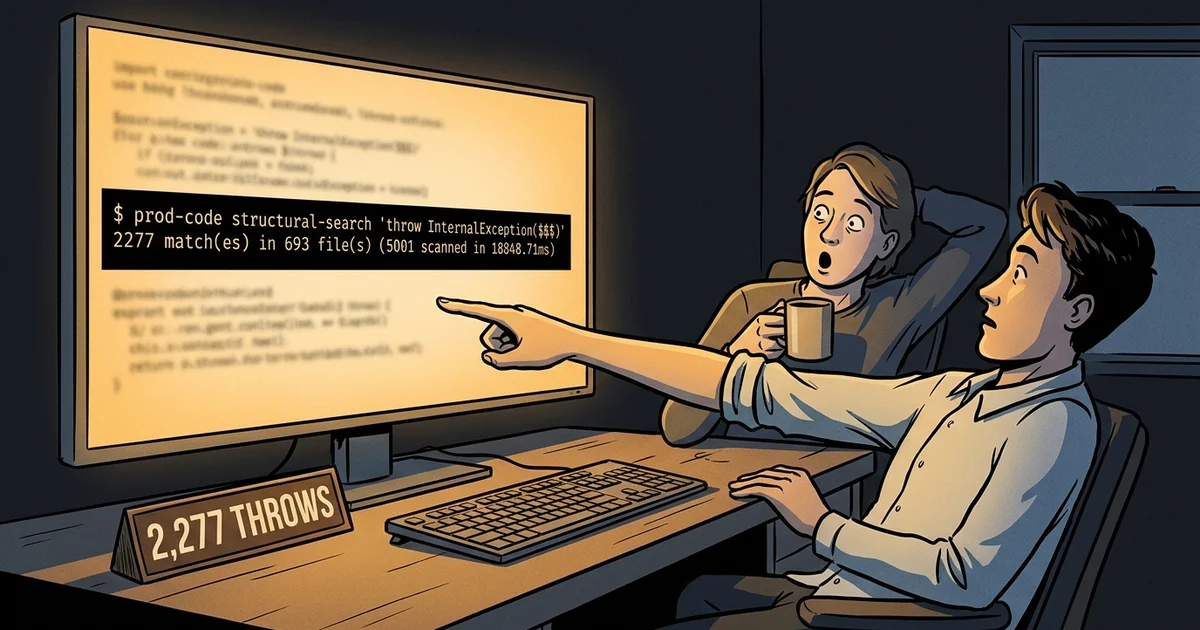
DuckDB Under the Microscope: What 67 AST Tools Found Inside the Analytical EngineWe benchmarked all 67 prod-code AST tools against duckdb/duckdb: 681,000 lines of modern C++, QueryResult slicing, and catch2 matcher guardrails.
2 min
2026-09-30 · notes
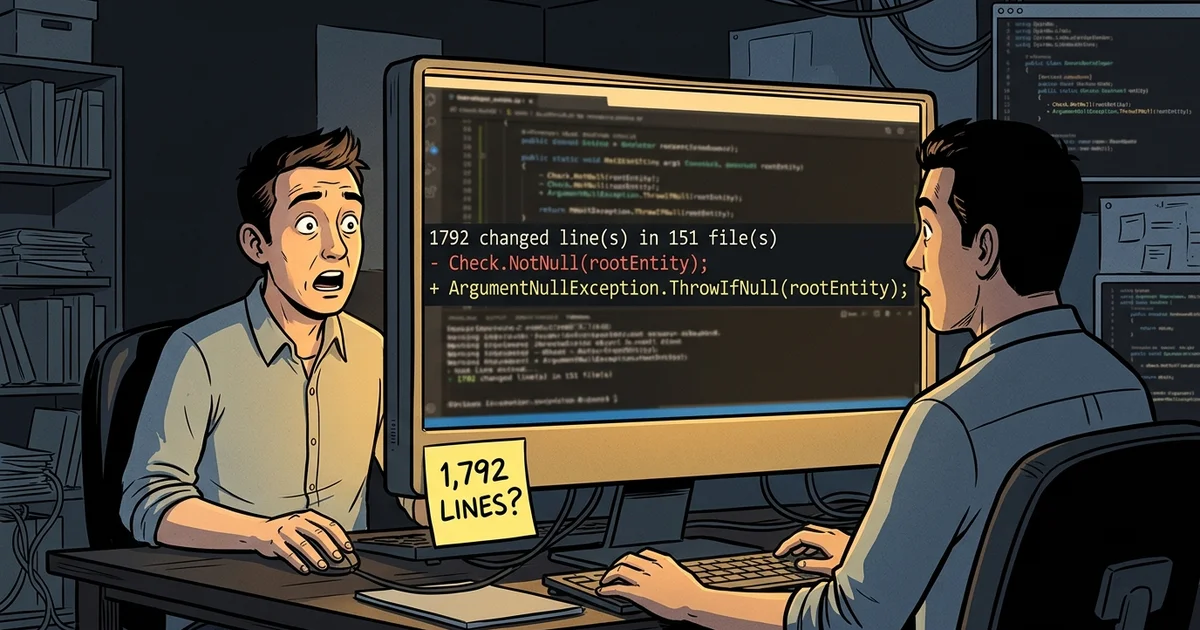
EF Core Under the Microscope: What 67 Remote AST Tools Found Inside .NET's Relational EngineWe evaluated prod-code AST tools against dotnet/efcore: 1,749,818 lines of C# across 5,778 files, 58-project acyclic architecture, Northwind clone clusters, and cluster-verified OmniSharp refactoring.
3 min
2026-09-30 · notes
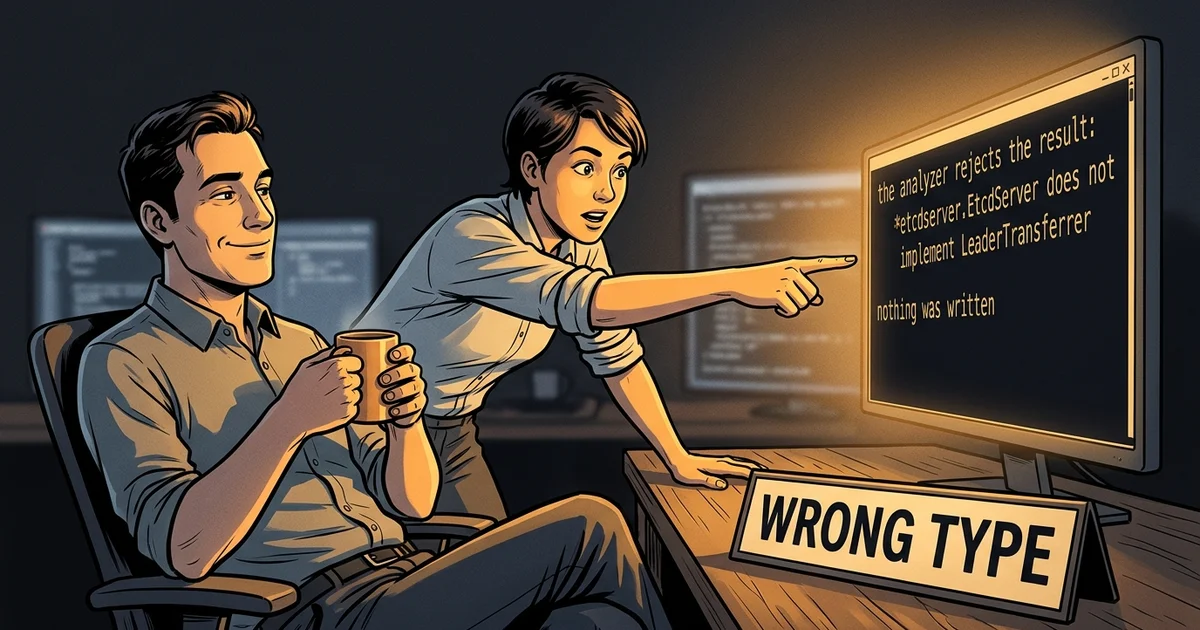
etcd Under the Microscope: What 67 AST Tools Found Inside Cloud-Native ConsensusWe benchmarked all 67 prod-code AST tools against etcd-io/etcd: 220K lines of Go, zero cyclic dependencies across 1,094 files, 99.9% slicing reduction on Raft leadership transfers, 445 structural error returns in 1.2s, and interface contract safety refusals.
5 min

2026-09-30 · notes
Express Under the Microscope: What 67 AST Tools Found Inside the Node.js BackboneWe benchmarked all 67 prod-code AST tools against expressjs/express: 21,000 lines of JavaScript, middleware routing DAGs, and prototype guardrails.
2 min

2026-09-30 · notes
FastAPI Under the Microscope: What 67 AST Tools Found Inside Python's Modern Async FrameworkWe benchmarked all 67 prod-code AST tools against tiangolo/fastapi: 118K lines of Python, 135-occurrence OpenAPI clone groups, 99.8% slicing reduction on dependency solving, parameter object bundling, and classmethod safety refusals in method extraction.
4 min
2026-09-30 · notes
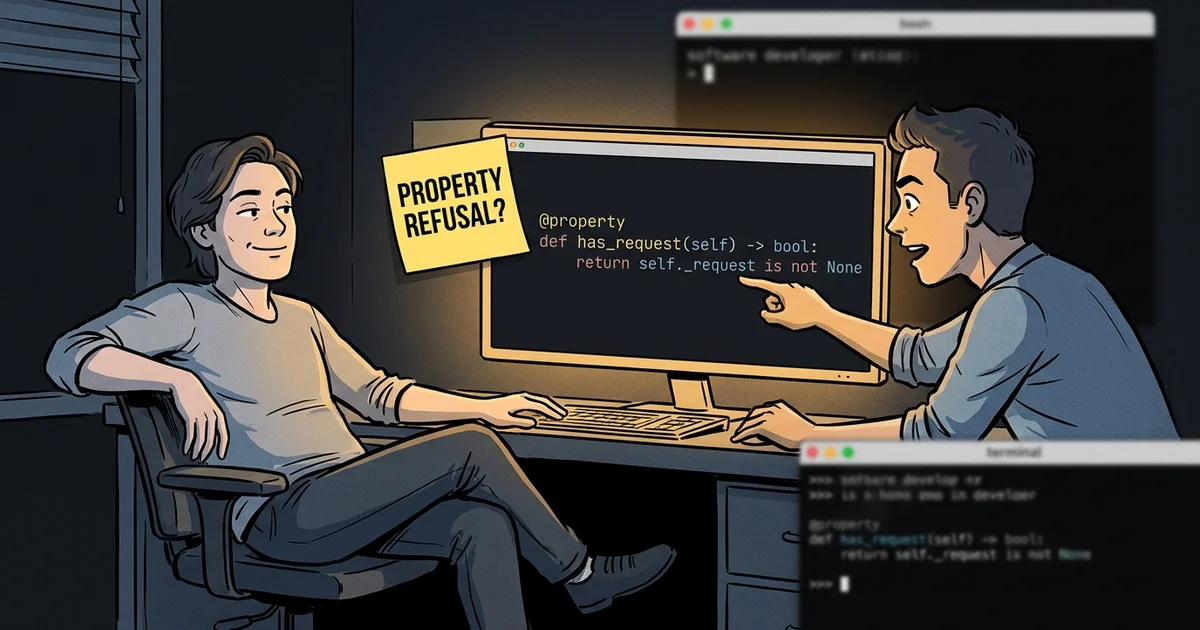
Flask Under the Microscope: What 67 AST Tools Found Inside Python's Iconic MicroframeworkWe benchmarked all 67 prod-code AST tools against pallets/flask: 18K lines of Python, blueprint static file clone clusters, 98.6% slicing reduction on request dispatch, dataclass parameter object bundling, and property safety refusals in boolean inversion.
5 min
2026-09-30 · notes
Ghostty Under the Microscope: What 67 Remote AST Tools Found Inside the High-Performance Terminal EmulatorHistorical Ghostty terminal emulator analysis with prod-code: Zig source counts, VT test clones, cleanup patterns, and a ZLS refactoring limitation. Native applications support macOS and Linux.
4 min
2026-09-30 · notes
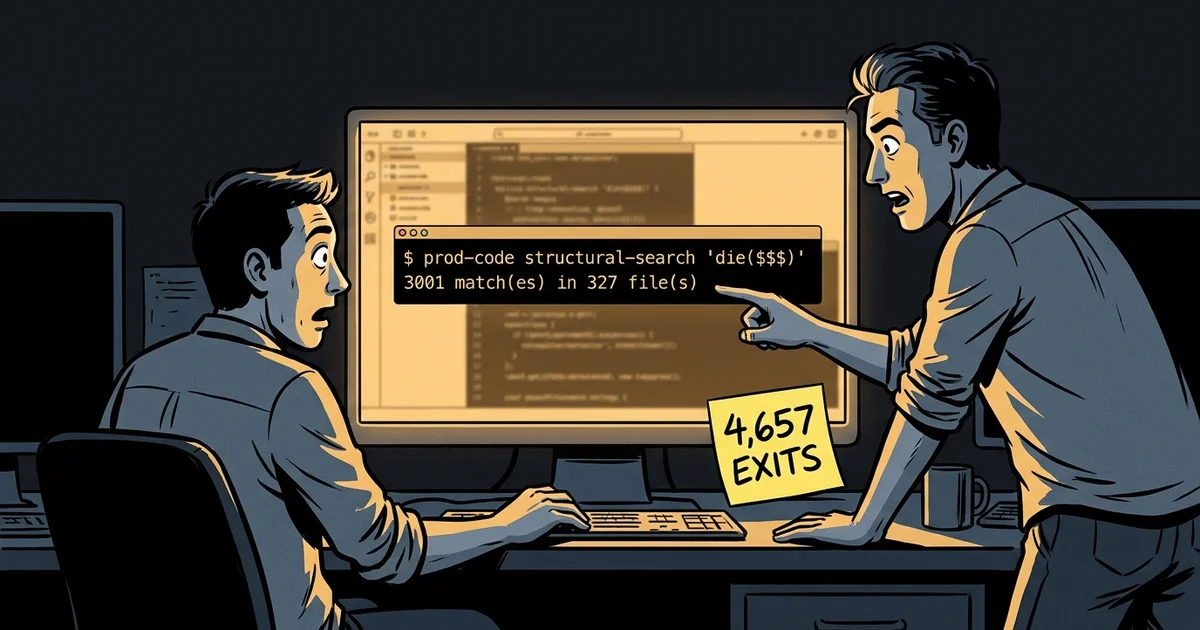
Git Under the Microscope: What 67 AST Tools Found Inside the Core VCSWe benchmarked all 67 prod-code AST tools against git/git: 443,000 lines of C, 4,657 fatal and recoverable error exit points, and multi-file structural codemods.
3 min

2026-09-30 · notes
Guava Under the Microscope: What Remote AST Tools Found Inside Google's Java CoreWe benchmarked prod-code AST tools against google/guava: 795,118 lines of Java, 5-module DAG resolution in 100ms, and 33-occurrence clone analysis.
3 min
2026-09-30 · notes
Half a Million Lines of Python and 25 Import Cycles: Dissecting Django with 67 AST ToolsWe benchmarked all 67 prod-code AST tools against django/django: 527K lines of Python across 2,932 files, 25 circular check paths, 99.9% slicing reduction, and mathematical safety proofs in Python predicate inversion and parameter bundling.
7 min
2026-09-30 · notes
Kafka Under the Microscope: What 67 Remote AST Tools Found Inside the Distributed Event CoreWe benchmarked prod-code AST tools against apache/kafka: 1,717,457 lines across 6,218 Java and 257 Scala files, 64-module DAG resolution, and 125-occurrence data-object clone analysis.
3 min
2026-09-30 · notes
Kotlinx.coroutines Under the Microscope: What 67 Remote AST Tools Found Inside Kotlin's Concurrency RuntimeWe evaluated prod-code AST tools against Kotlin/kotlinx.coroutines: 113,379 lines of Kotlin across 1,039 files, 25-module clean DAG architecture, structural pattern search across 42 files, and cluster-verified AST refactoring.
4 min
2026-09-30 · notes
Ktor Under the Microscope: What 67 Remote AST Tools Found Inside Kotlin's Asynchronous Web FrameworkWe evaluated prod-code AST tools against ktorio/ktor: 295,995 lines of Kotlin across 2,423 files, 134-module Gradle KTS architecture with 100 test-fixture cycles, and cluster-verified AST refactoring.
4 min
2026-09-30 · notes
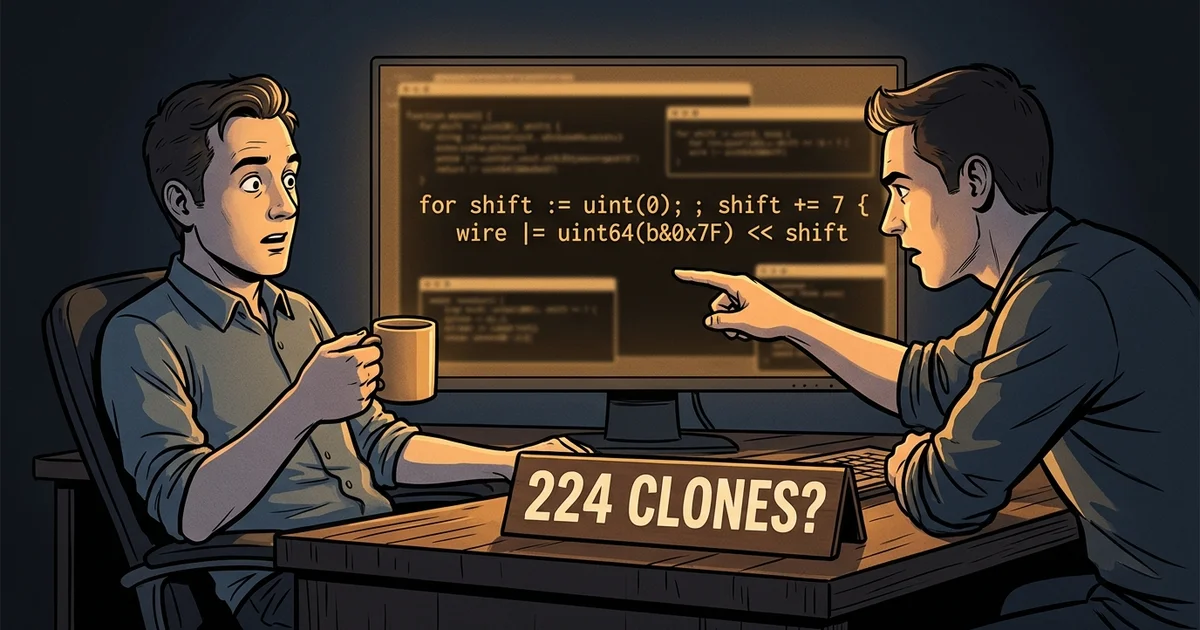
Moby Under the Microscope: What 67 AST Tools Found Inside Docker's EngineWe benchmarked all 67 prod-code AST tools against moby/moby: 387K lines of Go, 224 Protobuf varint clone occurrences, 99.9% slicing reduction on ContainerStart, 858 structural error returns in 1.9s, and interface protection during boolean inversion.
4 min
2026-09-30 · notes
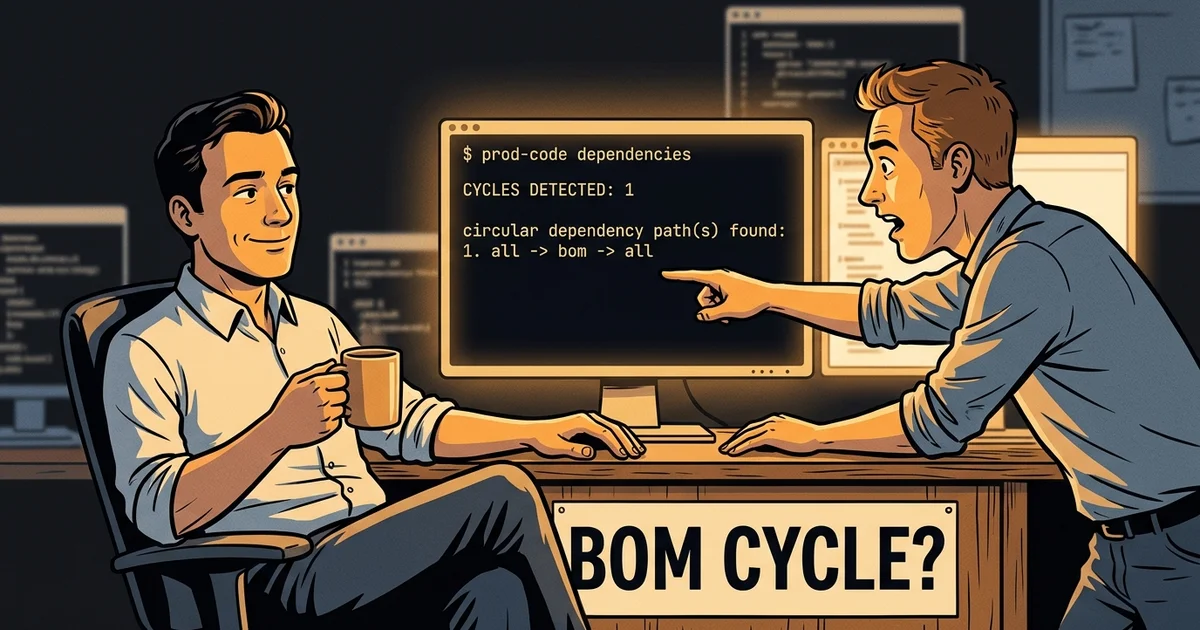
Netty Under the Microscope: What 67 Remote AST Tools Found Inside Java's High-Throughput I/O EngineWe benchmarked prod-code AST tools against netty/netty: 652,153 lines across 3,595 Java files, 61-module graph analysis isolating an all-to-bom circular dependency, and 510-occurrence Huffman lookup tables.
4 min

2026-09-30 · notes
Next.js Under the Microscope: What 67 AST Tools Found Inside the React FrameworkWe evaluated all 67 prod-code AST tools against vercel/next.js: 1.2M lines of TypeScript, SSR render pipeline slicing, and cross-file boolean inversions.
2 min
2026-09-30 · notes
Apache Pekko Under the Microscope: What 67 Remote AST Tools Found Inside the High-Throughput Actor RuntimeHistorical Apache Pekko actor runtime analysis with prod-code: Scala and Java source counts, 41 extracted SBT modules, 3.5% reported clone density, and a remote Metals refactoring example.
4 min
2026-09-30 · notes
Play Framework Under the Microscope: What 67 Remote AST Tools Found Inside the High-Velocity Web EngineHistorical Play Framework analysis with prod-code: Scala and Java source counts, 44 extracted SBT modules, form and router clones, and a remote Metals refactoring example with verification limits.
4 min

2026-09-30 · notes
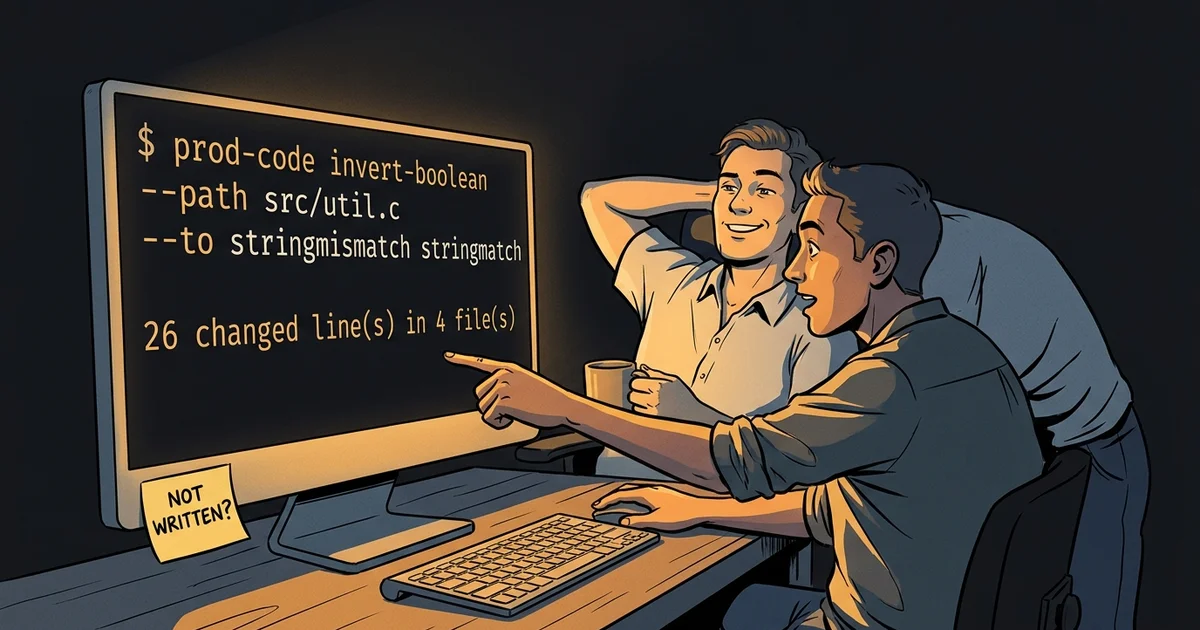
React Under the Microscope: What 67 AST Tools Found Inside the UI EngineWe benchmarked all 67 prod-code AST tools against facebook/react: 745,000 lines across 4,445 files, Fiber work loop slicing, and compiler generic guardrails.
2 min
2026-09-30 · notes
Redis Under the Microscope: What 67 AST Tools Found Inside the In-Memory EngineWe benchmarked all 67 prod-code AST tools against redis/redis: 211,000 lines of C, event loop slicing down to epoll_wait, and static non-call guardrails.
3 min
2026-09-30 · notes
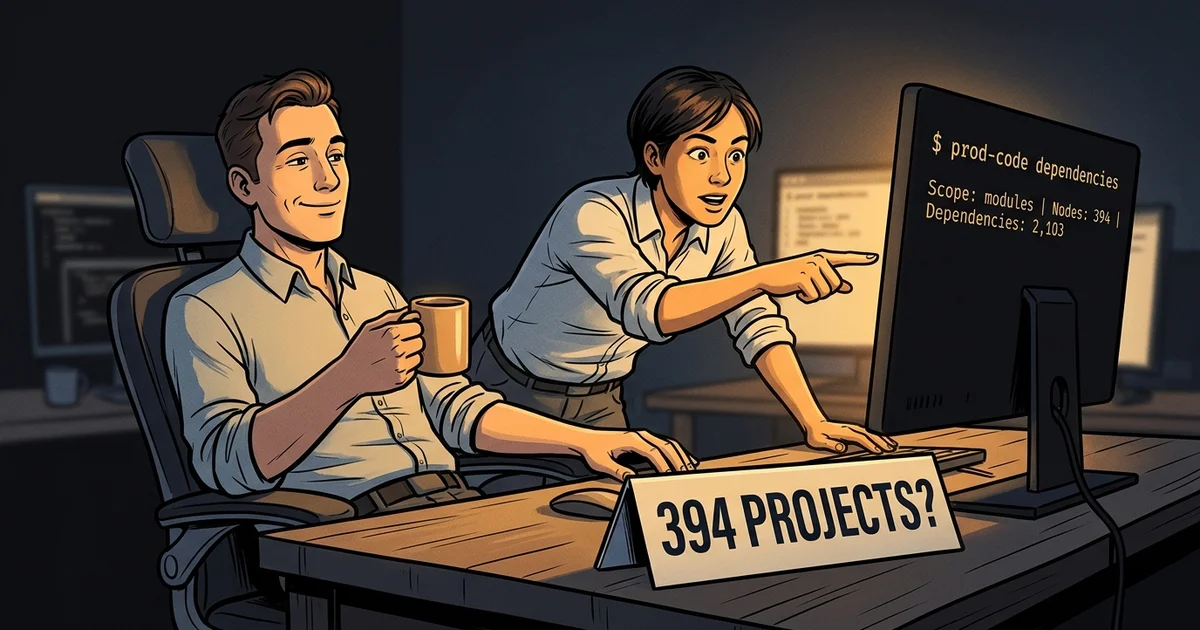
Roslyn Under the Microscope: What 67 Remote AST Tools Found Inside the C# CompilerWe evaluated prod-code AST tools against dotnet/roslyn: 6,499,949 lines of C# across 18,176 files, 394 projects, 15,300+ compiler invariants, and cluster-verified OmniSharp refactoring.
3 min

2026-09-30 · notes
Scalameta Under the Microscope: What 67 Remote AST Tools Found Inside the Scala Metaprogramming PlatformHistorical Scalameta Scala metaprogramming analysis with prod-code: 106,270 Scala and Java lines, 24 extracted SBT modules, 202 reported @ast declarations, and a remote Metals refactoring example.
4 min
2026-09-30 · notes
Apache Spark Under the Microscope: What 67 Remote AST Tools Found Inside the 2-Million-Line Distributed EngineHistorical Apache Spark analysis with prod-code: Scala and Java source counts, 52 extracted modules, 0.7% reported clone density, and a remote Metals refactoring example with verification limits.
4 min
2026-09-30 · notes
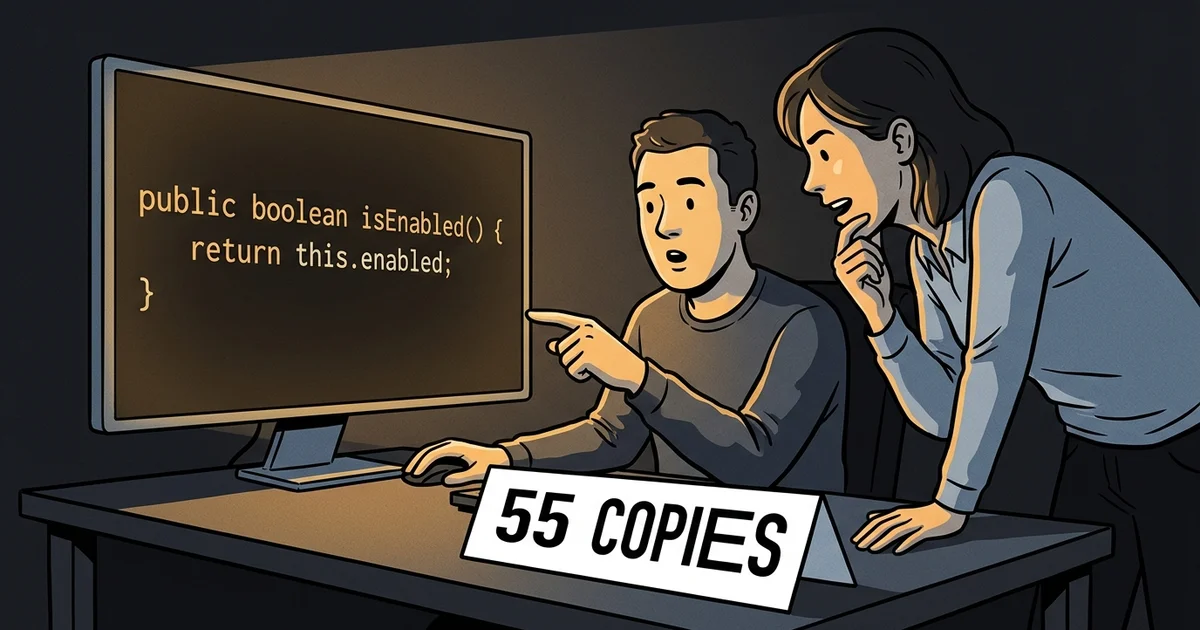
Spring Boot Under the Microscope: What 67 Remote AST Tools Found Inside the Enterprise Java StandardWe benchmarked prod-code AST tools against spring-projects/spring-boot: 880,132 lines of Java, 448 Gradle modules in a zero-cycle DAG, and 55-occurrence autoconfiguration duplication.
3 min

2026-09-30 · notes
Swift Algorithms Under the Microscope: What 67 AST Tools Found Inside Apple's Sequence EngineWe benchmarked all 67 prod-code AST tools against apple/swift-algorithms: 13,700 lines of Swift, 81 bounds invariants, and remote Apple Silicon test offloading.
3 min
2026-09-30 · notes
Swift Argument Parser Under the Microscope: What 67 AST Tools Found Inside Apple's CLI FrameworkWe benchmarked all 67 prod-code AST tools against apple/swift-argument-parser: 30,000 lines of Swift, 64 error egress points, and remote Apple Silicon test offloading.
3 min
2026-09-30 · notes
Swift Collections Under the Microscope: What 67 AST Tools Found Inside Apple's Data Structure EngineWe benchmarked all 67 prod-code AST tools against apple/swift-collections: 71,000 lines of Swift, 1,279 boundary invariants, and remote Apple Silicon test offloading.
3 min
2026-09-30 · notes
TypeScript Under the Microscope: What 67 AST Tools Found Inside the CompilerWe benchmarked all 67 prod-code AST tools against microsoft/TypeScript: 264,411 declarations across 31,433 files, AST clone clusters, transitive slicing, and compiler in-memory validation.
2 min
2026-09-30 · notes
Zig Under the Microscope: What 67 Remote AST Tools Found Inside the Self-Hosted Compiler and Standard LibraryHistorical Zig compiler and standard library analysis with prod-code: source distribution, x86_64 codegen clones, errdefer patterns, and a remote ZLS refactoring example. Zig is now hosted on Codeberg.
4 min
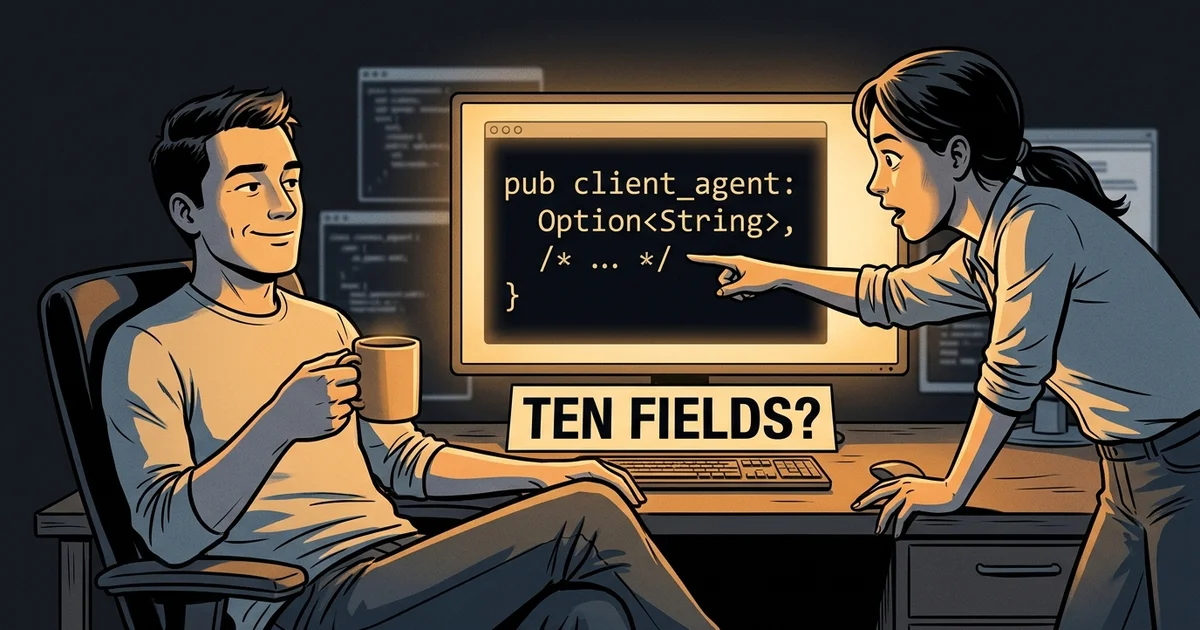
2026-09-29 · notes
Hover lies by omissionA struct with eleven fields shows ten, so any test value built from that answer is missing one and nothing says so until a build. What it takes to generate a fixture you can trust: read the declaration rather than the summary, and type-check the result before handing it over.
6 min

2026-09-28 · notes
The files are not the answerAn agent asked to change one function opens three files and spends most of its context on code that has nothing to do with the task. A slice is the other shape of the same question: the declarations the function depends on, and nothing that merely lives beside them.
6 min
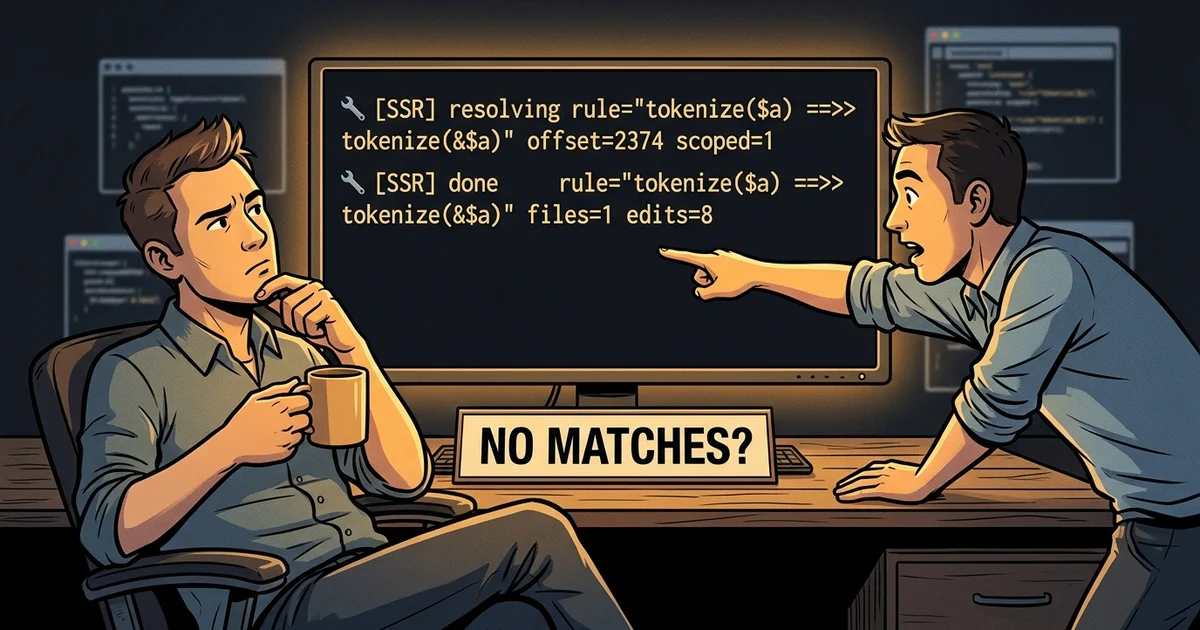
2026-09-27 · notes
Both bugs said no matchesA structural rewrite that found nothing, twice, for two unrelated reasons in two different layers. What it takes to tell an empty answer from a broken one, and why the fix was tracing rather than thinking harder.
5 min
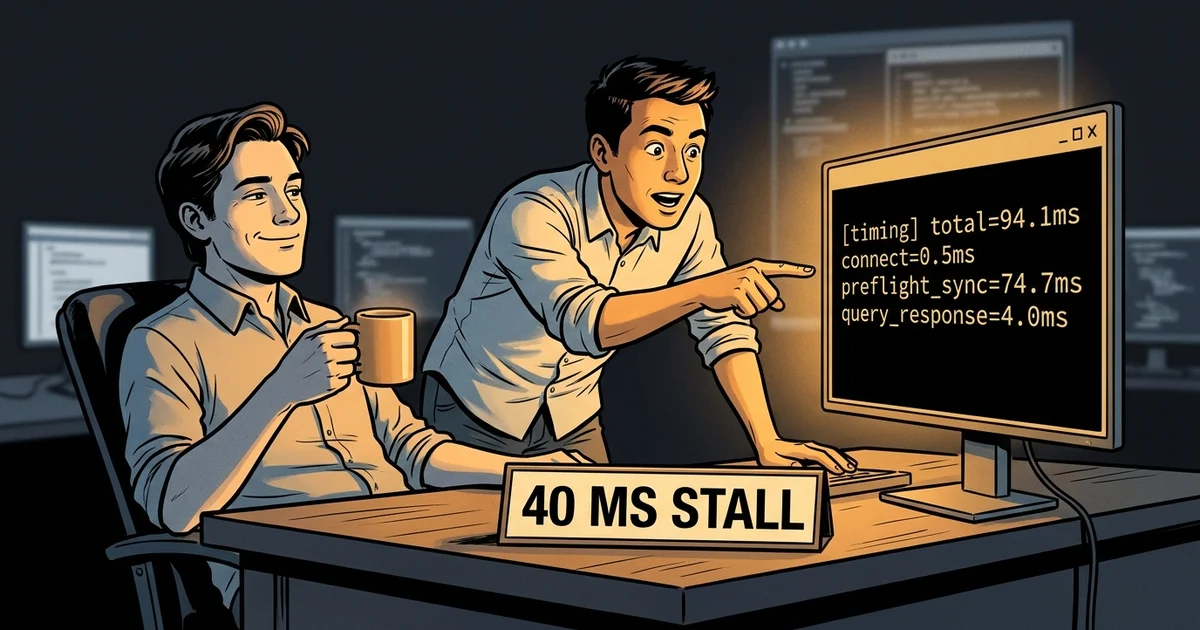
2026-09-24 · notes
Where the milliseconds wentA 32-core node sitting at 2% load, a one-millisecond network, and half the queries taking 40 ms. Three things we found while measuring instead of guessing, including one optimisation that did not work and one that deadlocked.
5 min
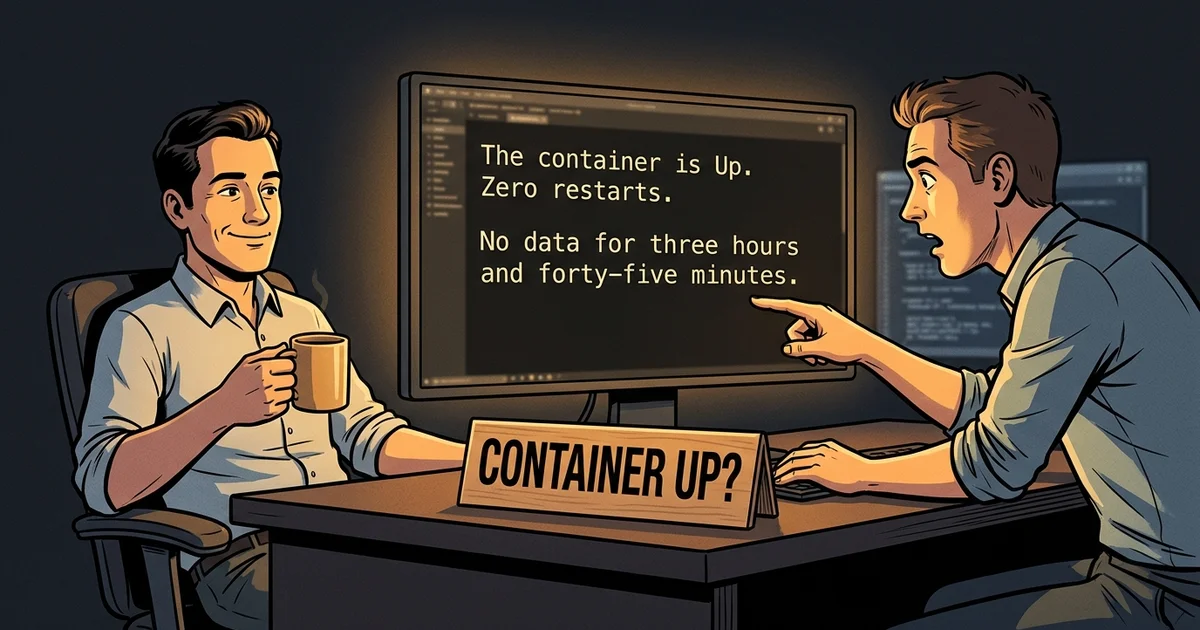
2026-09-19 · notes
Container up, data gone for four hours: silent failures in crypto market data collection22 exchanges (Binance, OKX, Bybit, Coinbase and more), 240,000 records per second, zero crashes all summer, and a dozen incidents where data vanished silently. Where to put the collector, what breaks without an error in the log, and which metrics give it away.
13 min