
Container up, data gone for four hours: silent failures in crypto market data collection
22 exchanges (Binance, OKX, Bybit, Coinbase and more), 240,000 records per second, zero crashes all summer, and a dozen incidents where data vanished silently. Where to put the collector, what breaks without an error in the log, and which metrics give it away.
On this page · 4 sections
The container is Up. Zero restarts. Memory is flat, metrics leave every six seconds, 126 symbols are subscribed. No data for three hours and forty-five minutes. This is not a hypothetical: it is one of our incidents, and it had three twins with different causes. They share one thing: no sign of “the process is alive” says anything about whether data is flowing. Collecting market data from crypto exchanges is a discipline in which almost everything breaks quietly, and this post is about where the quiet comes from.
We record trades and best bid/offer (BBO) from two dozen crypto exchanges: Binance (spot, USD-M and COIN-M), OKX, Bybit, KuCoin, Gate.io, Coinbase, Hyperliquid, HTX, Bitget, MEXC, BingX, BitMart, Bitunix, Toobit, Aster. Today that is 22 collectors, about 5,350 instruments, roughly 44,000 records per second out of 24,000 WebSocket frames. The data feeds backtests and trading models, so a gap, a duplicate or a time shift is not cosmetic; it is a wrong decision made a month later on top of that data. Exchanges below are named, but the names are not the point: the failure shapes are, and they repeat everywhere.
What a market-data collector is made of
One process per exchange. It calls REST for the instrument list and its metadata (price step, quantity step, limits), splits symbols into groups that fit the subscription limits, opens WebSockets and parses frames into fixed-width records: symbol, price, quantity, side, two timestamps, the exchange’s and ours. Records are batched and pushed into a persistent stream. A separate server drains the stream and lays the records out into an analytical database and into daily per-instrument archives.
exchange ──ws──▶ collector ──batches──▶ stream ──▶ server ──▶ database + archive
                 │
                 └─ REST: instruments, steps, limits (id → symbol map)
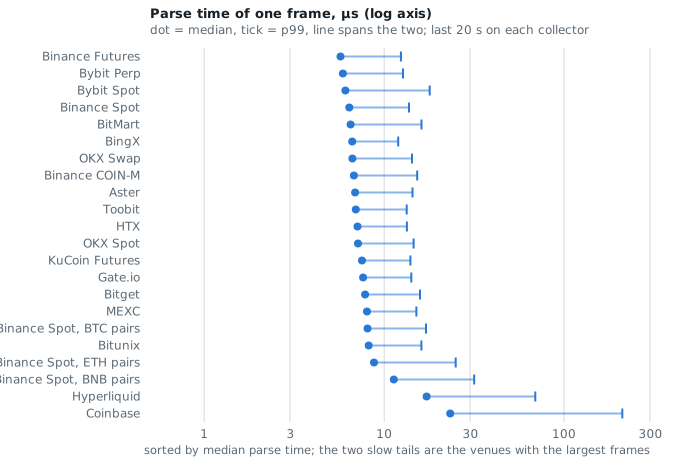
Parsing a frame is the cheapest part of the pipeline, and that is deliberate: the parser reads fields in a known order, builds no tree and allocates nothing. Our median parse time for one frame is 5–11 µs, p99 is 12–32 µs, and only Hyperliquid and Coinbase, with the heaviest frames, stand out at a p99 of 69 and 210 µs. At a peak of 90,000 records per second on a single venue, parsing takes a fraction of a percent of one core; the rest of the time the process is waiting on the network.
Between the socket reader and the packer there is a queue. We recently replaced it with one of our own, lock-free and allocation-free on the hot path; that is a separate post, and the number that matters here is this one: on 21 of 22 collectors the average queue depth is below one record. The queue is not supposed to be a buffer. It is supposed to be empty; when it fills, that is a symptom, not work.
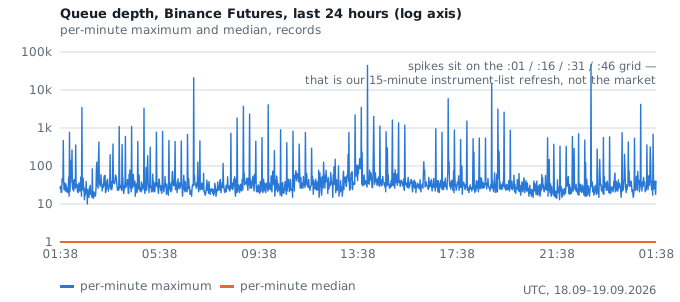
A symptom of what, the shape of the chart tells. On Binance Futures the daily median queue depth never leaves one, the per-minute maximum is usually 20–60 records, and the spikes into the tens of thousands sit exactly on the :01, :16, :31, :46 grid. Markets do not run on a schedule. Our own instrument-list refresh does, every fifteen minutes: while the collector reconciles the catalog, the socket keeps delivering, and the queue reports it honestly. The same comb shows on Bybit, Gate.io and KuCoin, exactly the four venues where that refresh is enabled, and on none of the others. We found this while drawing the chart for this post.
Two things in this diagram matter more than the rest. The first is the “numeric id → symbol” map. Records on the wire carry an id, not a name, and if the collector’s map and the server’s map drift apart, the database silently writes one instrument’s price under another’s name. The second is the exchange timestamp next to ours. Their difference is the best latency gauge available, and it also catches half of the failures below.
Where to watch the exchange from: latency, DNS and per-IP limits
The delay from “the exchange stamped the event” to “we received the frame” spreads across two orders of magnitude between venues on the very same host: the trade median runs from 1.6 ms on Binance Spot to 230 ms on Hyperliquid. That is not our network; it is where the exchange’s matching engine sits, which CDN it serves sockets through, and how its own publishing pipeline is built. So the first question when adding a venue is not “how do we parse it” but “where do we connect from”, and the answer has to be measured, not read in the documentation.
Measuring the country is not enough. Our MEXC collector lived with a quarter-second delay for
a year, and nothing signalled: frames arrived, parsed, metrics were green. The cause was DNS.
The host contract.mexc.com turned out to be a CNAME onto Akamai, and a CDN picks the nearest
edge by the resolver’s address unless the resolver forwards the client subnet (EDNS Client
Subnet). The hosting provider’s resolver answered from another part of the world, and the TCP
handshake to the edge it handed out took 221 ms against 0.4 ms to the edge a public resolver
returned. After switching resolvers the delay floor dropped from 236 ms to 10 ms and the
median from 446 to 188 ms. What remains is the exchange’s own pipeline. The shape of this
failure is worth remembering: a wrong resolver does not fail. It works, from the wrong place.
The second thing that depends on location is per-IP limits. Exchanges cap the number of
connections and the rate of new connections from one address, and the cap is per domain, not
per product. Our two Bybit collectors (futures and spot, one domain stream.bybit.com) on one
host together exceeded 500 new connections in five minutes and collected 72,672 HTTP 403
responses in an hour; both containers were Up the whole time. Hyperliquid allows ten sockets
per IP and we were opening 24, because we split symbols by ten and did not filter out the
delisted ones. The connections never died for good; they cycled, and “the collector is
running” was true at every individual moment.
Hence the practice: each venue gets its own host, or at least its own address; connection topology is derived from the documented limits with margin, not from a convenient group size; and after a restart, connections are not opened in one salvo.
What breaks when nothing crashes: silent WebSocket failures
Our incident log for the summer consists almost entirely of failures during which the process was alive. These are the ones worth knowing in advance.
The peer vanished without FIN or RST. Coinbase: 17 established sockets, 2 hours 33
minutes without a single byte. A transport with no read timeout and no accounting of replies
to its own pings never learns that the other side is dead: read simply never returns, and
the reconnect never fires because there is nothing to fire it. A read timeout and pong
accounting are mandatory; TCP keepalive with the operating system’s default settings is not a
substitute.
The reconnect replays the past. Coinbase requires a JWT with a two-minute lifetime in every subscribe message. The collector signed it at startup and handed it to the transport, and on every reconnect the transport faithfully re-sent the same message set, token included. Any reconnect after the second minute of the process’s life produced silence. Four hours and twenty-two minutes. Anything with an expiry has to be computed at connect time, not at startup.
A reconnect storm feeds itself. Coinbase again. A 100 ms retry interval on all channels at once after a routine redeploy turned a dropped handshake into ten attempts per second per channel. The exchange kept dropping until the storm died down on its own. Exponential backoff with jitter is mandatory here.
Control messages are not errors. Subscription acknowledgements, application-level pongs and snapshots arrive on the same socket as the data. A parser that treats every unparsed frame as an error racks up hundreds of “parse error” per run on a perfectly healthy stream (OKX and OKX Spot gave us 280 and 226), and a real error is invisible in that noise. Classify the frame first, then diagnose, and diagnose exactly once per frame, not per record.
Field order on the wire does not match the documentation. Our parsers are fast precisely because they read fields in a known order and build no tree. The price is that a parser written from a documentation example silently returns nothing on a live frame. BitMart and BingX passed every test and published zero trades; with fixtures captured from the live socket the same run produced 3,502 and 80,338. A fixture is captured from a live socket only and committed verbatim.
A valid record does not have to be complete. HTX sends a one-sided BBO when the book has no other side. The parser demanded both and threw the frame away as malformed: 7,587 honest snapshots in six hours, and for a couple of instruments more was lost than stored.
One instrument under two names. Part of Coinbase’s catalog is aliases: USDC pairs point at the book of the same pair in USD. Subscribing to both the name and the alias delivers the same tape twice. 79 of 163 products turned out to be pointers; half of the trades were duplicates. Deduplicating by trade id on receipt hides this defect rather than fixing it: the filter belongs at instrument discovery.
Metadata is part of the data. An instrument’s price step on Binance changes, instruments
get listed between restarts, and a quantity limit on OKX Spot gets synthesised from the lot
size instead of reading maxMktSz, excluding 217 valid instruments outright. None of this
surfaces at collection time; it surfaces a month later, when a backtest rejects whole days
because a price does not land on the step grid, or a volume is one unit below the quantity
step, or the archive day does not exist at all. One audit produced 1,802 rejected symbol-days.
The instrument list and its parameters have to be refreshed at runtime and stored, versioned,
next to the data, not captured once at startup.
The symbol map is not stable. Our numeric ids are assigned at discovery, and after an OKX collector restart id 277 turned out to be a different instrument. As long as the map travels with the data, that does not matter. But one day a debug build on a laptop connected to the production stream and published its own map. The server took it as is, and for several hours trades of some instruments were written under the names of others; the public dashboard showed a 38,000,000 % gain, and 27 million rows were later purged from the database. Publishing to production must require an explicit environment flag, and a debug build must refuse to do it.
The flag that silently returns OK. We added that same flag to the server, but its container was deployed by hand, without the variable. The gate returned success without publishing: for ten days the daily archives were “announced ready” into the void, and the worker log was full of “successfully published”. A disabled publish must be an error, or at least a separate counter, never a success.
What to measure: freshness, delay, queue
The metric you need first is the age of the last record per venue, computed so that a dead collector also increases it. A metrics push gateway keeps the last value forever, so “seconds since the last record” freezes at zero for a dead process. We add two terms: the data’s own age plus the age of the last push. The threshold was not guessed: over seven days the worst across all 22 venues was 69 seconds (Hyperliquid), steady state is 8–18, the threshold is 300. Every rule is set the same way: measure the worst week, take a margin, check that the rule would not have fired once over that same week.
Then, in decreasing order of usefulness:
- Delay
our time − exchange timeper venue and record type, as quantiles. It caught the DNS story above and catches any route degradation. Each venue has its own threshold (our medians differ a hundredfold between Binance and Hyperliquid), so the rule compares against the venue’s own baseline, not a constant. The absolute value depends on clock synchronisation; to compare two routes it is more honest to race the same event by id than to subtract the exchange timestamp. - Frames by kind: data separately, control separately. In 30 minutes of the handshake incident there were 1,166 control frames and 0 trades. A single frame counter cannot show that.
- Parse errors as a share of all frames, not a count: one venue sends 10,000 frames per second, another a handful. Our worst weekly share is 0.40 %.
- Reconnects as a rate over a window, not as an event. Binance Futures has over a thousand a day and that is normal: the exchange cuts connections by lifetime itself. The alarm is a burst, not presence.
- Symbol count against its own daily maximum. A 60 % drop means the listing endpoint returned half, not that the market emptied out.
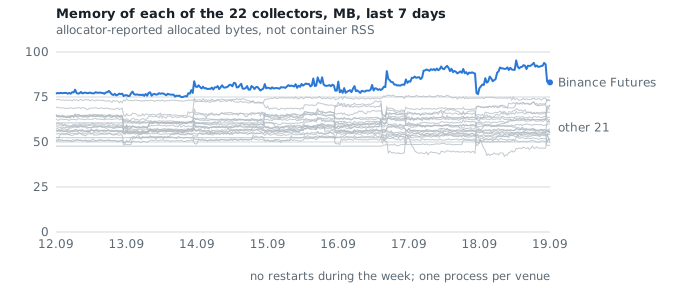
- Queue depth and memory. Average depth below one and 50–95 MB per collector is the baseline to measure deviation from. The queue is also needed as a per-minute maximum, not only as an average: the average hides short pipeline stalls.
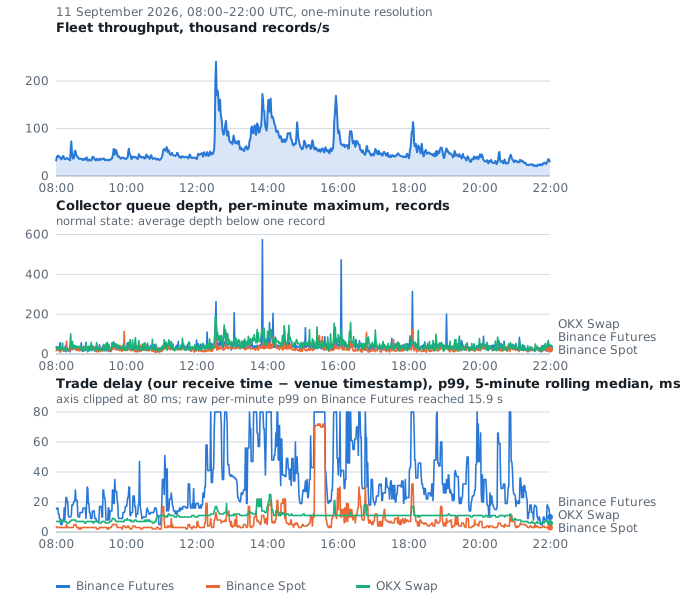
It is worth looking separately at what happens in an active market, because thresholds taken on a quiet day do not hold there. Our loudest hour of the month was 11 September: fleet throughput rose from the usual 40,000 records per second to 240,000 at the peak, 7× on Binance Futures, 15× on Binance Spot, 12× on OKX. Parsing did not notice the load, memory grew by 5–20 MB, and average queue depth stayed below two records on 21 of 22 collectors. But the per-minute queue maximum went from tens to 574, and p99 delay on Binance Futures from 13 to 55 ms. In the chart below p99 is smoothed with a five-minute window and the axis is clipped at 80 ms; the raw per-minute p99 reached 15.9 s in individual minutes. Under load, the first thing to give is neither CPU nor memory but the tail: rare records wait longer. A delay threshold taken on a quiet day fires falsely in such an hour, so the rule compares against the venue’s own baseline over the last hour, not a constant.
Collector memory does not grow: over a week all 22 stay within a 42–97 MB band with no restarts, and the only things visible on the chart are steps of a few megabytes when the instrument list is rebuilt and a slight rise on active days. If a line creeps upward, that is a leak in a buffer or in the symbol map, and memory is the easiest place to notice it.
And one trap in metrics export itself. The exporter library evicted any histogram that had not been written to for ten seconds, and the server writes metrics in batches every 20–40 seconds. Series vanished between batches and were recreated from zero: counters decreased without a restart, and the set of venues changed from one scrape to the next. A metric that flickers is worse than a missing one, because dashboards get built on it in the meantime.
The rule it all comes down to: a live process is not a signal. The signal is a fresh record, with a plausible delay, under the right name, in the expected quantity. Everything described above is a way to get the first without the second.
This is the first post of a series. Each section above is a summary of a separate story, and we will take them one at a time, with code and numbers:
- How many sockets to open to an exchange: per-IP connection limits and topology. How to derive connection topology from a venue’s limits, why two collectors on one IP only see each other through 403s, and what happened when we opened 24 sockets where 10 are allowed.
- Parsing a WebSocket frame in 6 microseconds without a tree. Field order on the wire, a cursor parser, fixtures from the live socket, and why “green tests, zero trades” is the expected outcome when the fixture comes from the documentation.
- Instrument metadata travels with the data. A price step that changed on Wednesday, an instrument listed on Thursday, and a backtest that rejected both weeks on Friday. How we went from “capture at startup” to runtime refresh, and what it cost the queue.
- Three silent failures of one exchange: read timeout, JWT and the reconnect storm. A peer without FIN, a two-minute token and a retry every 100 ms: one transport, three different holes, and what we rewrote in it.
Cite this article
Alexander Panasenko (2026-09-19). Container up, data gone for four hours: silent failures in crypto market data collection. https://prod.codes/blog/collecting-market-data-intro/